Find Out How Much Chicago Buildings Pollute
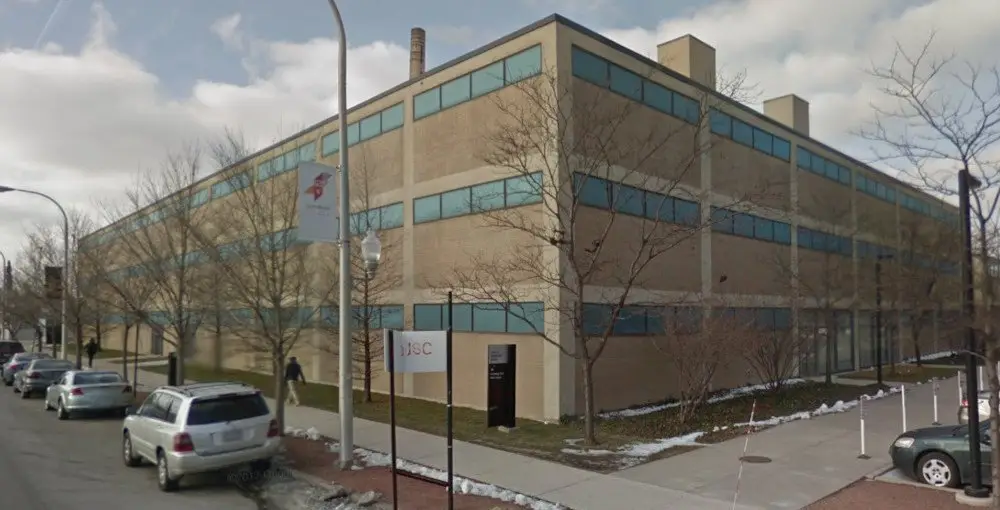
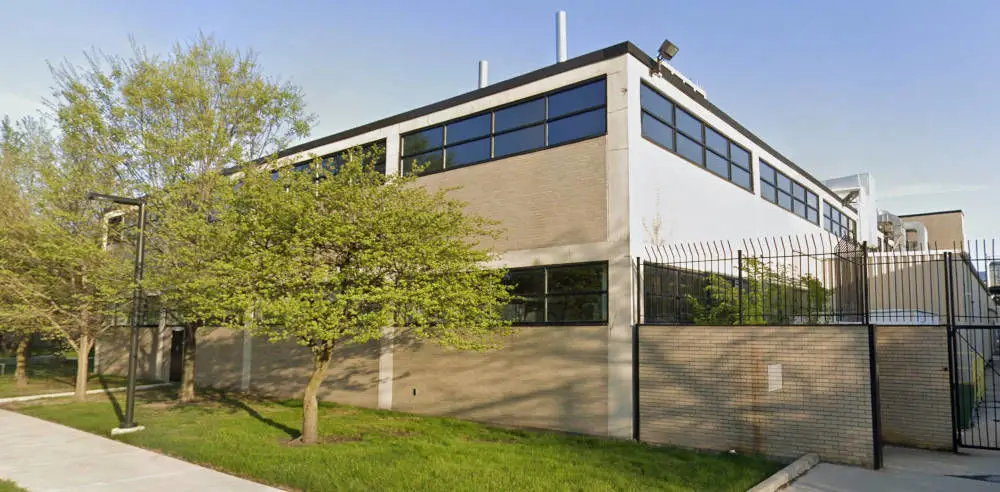
Chicago's Most Emissions Intense Buildings
View MoreThe buildings that reported the highest greenhouse gas emissions per square foot

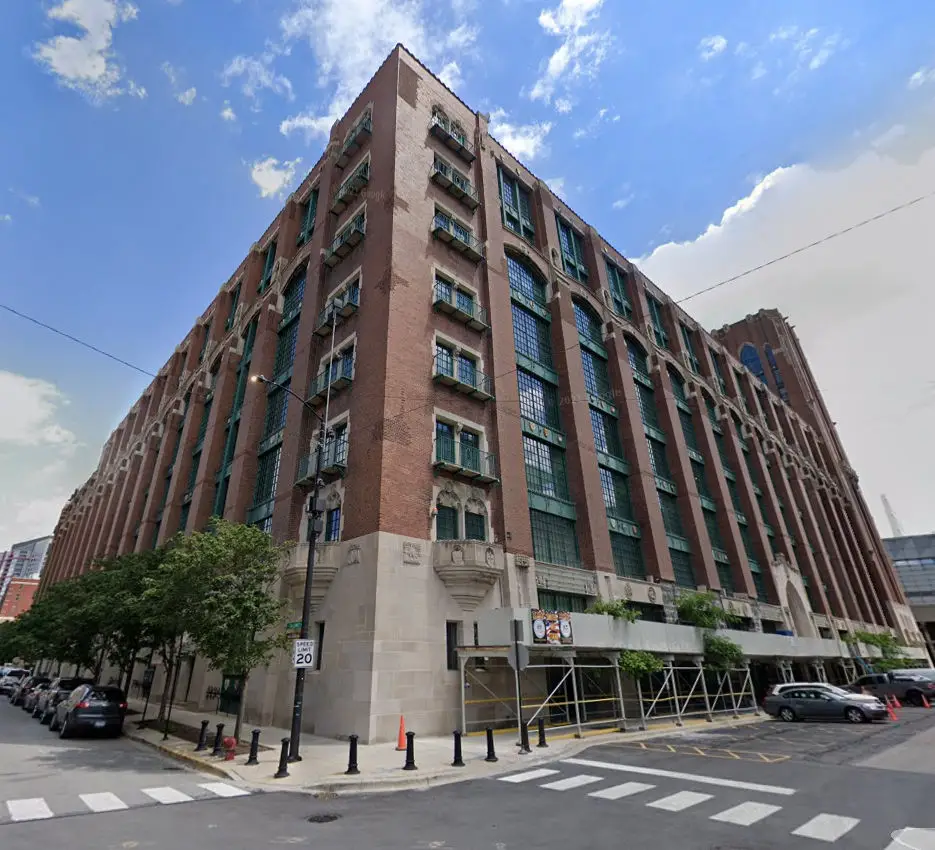

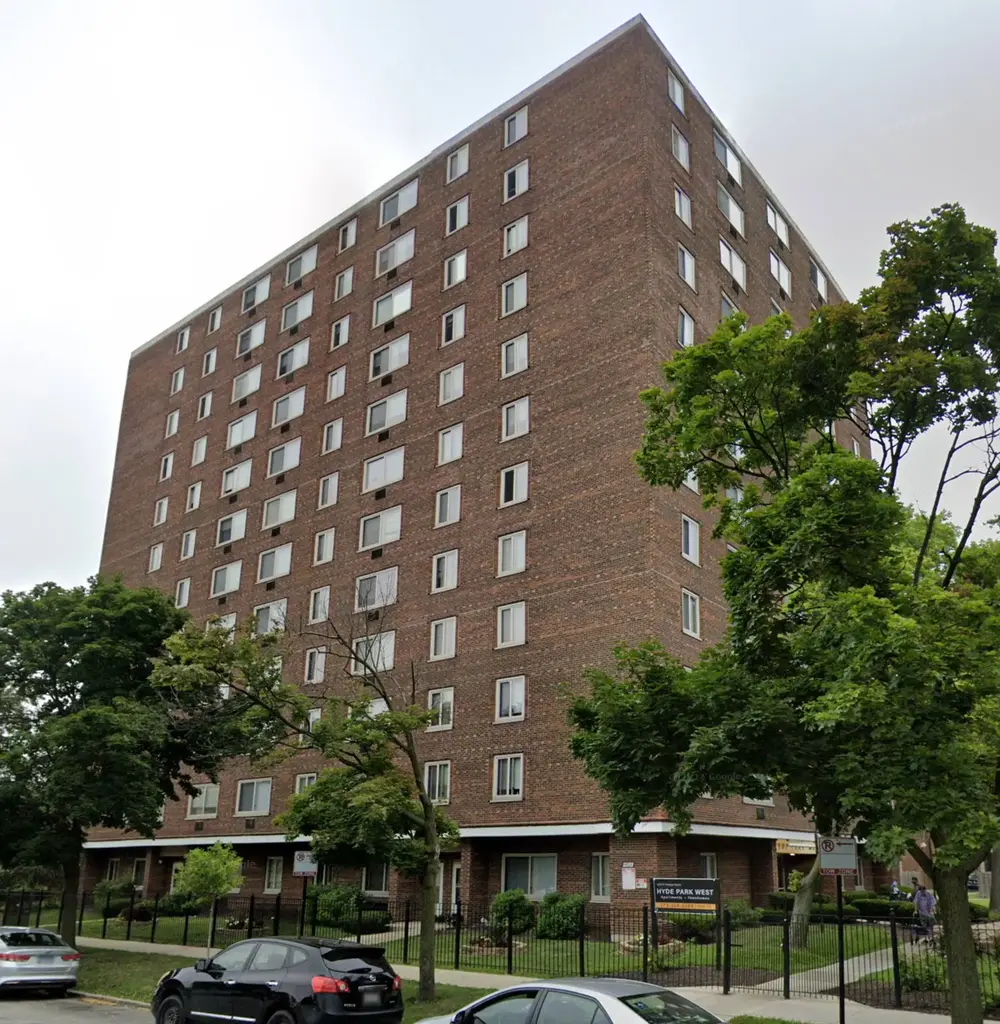


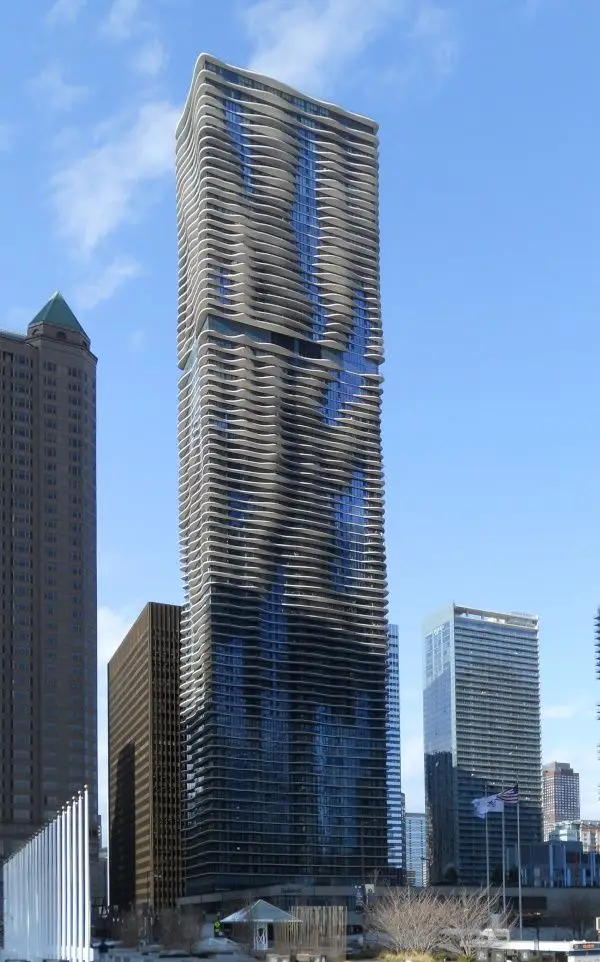
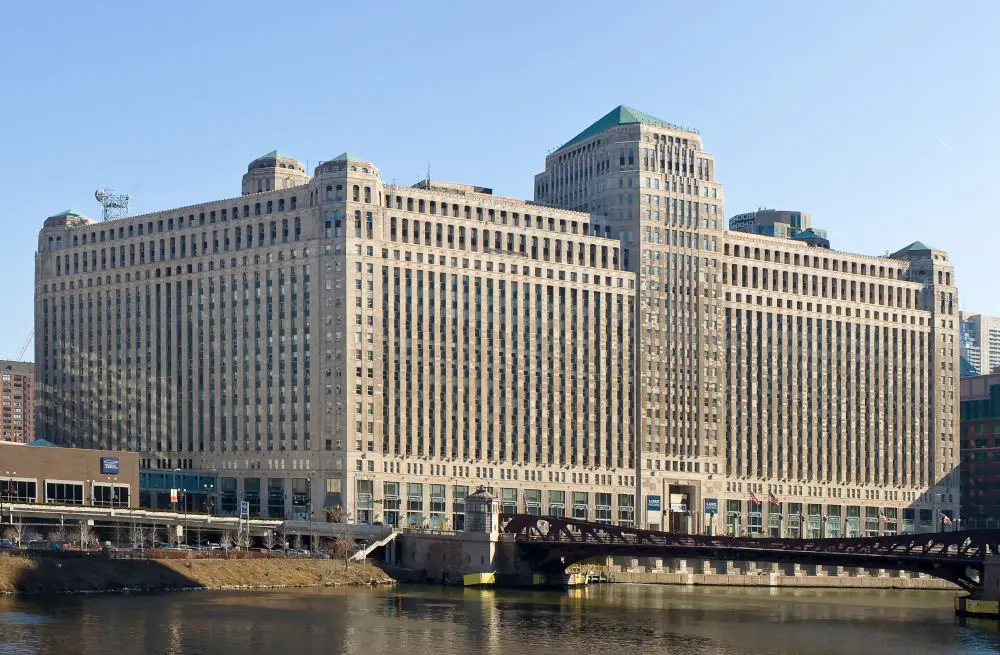
Featured Chicago Buildings
Check out some of Chicago’s most famous buildings, and learn how they use energy


Our Research & Updates
🎉 Updated with Latest (2023) Data!
Aug. 2025
We've updated with the latest 2023 Chicago energy benchmarking data (the most recent data available, released by the city in February 2025). See what buildings are new in the data, and which stopped reporting.
📰 Do High Emitting Buildings Stop Reporting?
Mar. 6th, 2025
Many buildings in Chicago that fall under the benchmarking requirements don't report their energy use and emissions. We investigated if there was a pattern at play, and whether poor performing buildings stopped reporting at higher rates than good performers.
📰 $30 Million In Missed Fines
Feb. 2nd, 2024
The City Of Chicago failed to collect $30 million in potential fines from the building benchmarking ordinance, reducing transparency and accountability.
Note: Data From Large Buildings in 2023
Note: This data only includes buildings whose emissions
are reported under the
Chicago Energy Benchmarking Ordinance . According to the City “As of 2016, this list includes all
commercial, institutional, and residential buildings larger than 50,000
square feet.”
. According to the City “As of 2016, this list includes all
commercial, institutional, and residential buildings larger than 50,000
square feet.”
The latest year of data is from 2023, but we update the site regularly when new data is available, and some buildings may have failed to report that year, and only have older data available.
Additionally, note that all tons specified are metric tons.
Data Source:
Chicago Energy Benchmarking Data