Buildings Owned By City of Chicago
City of Chicago Quick Stats
9
Tagged Buildings
Total Emissions
20,412
metric tons CO2 equivalent
24x the median building (841.4
tons CO2e)
Avg GHG Intensity
10.3
kg CO2e/sqft
2x the median building (6.2
kg CO2/sqft)
Grade Distribution
Total Square Footage
1.8M
million sq ft under management
Avg Building Age
64
years old
City of Chicago Buildings List
Note: Building owners are manually tagged, so this may not be a definitive or perfect list.
Note: Data From Large Buildings in 2023
Note: This data only includes buildings whose emissions
are reported under the
Chicago Energy Benchmarking Ordinance . According to the City “As of 2016, this list includes all
commercial, institutional, and residential buildings larger than 50,000
square feet.”
. According to the City “As of 2016, this list includes all
commercial, institutional, and residential buildings larger than 50,000
square feet.”
The latest year of data is from 2023, but we update the site regularly when new data is available, and some buildings may have failed to report that year, and only have older data available.
Additionally, note that all tons specified are metric tons.
| Name / Address | Primary Property Type | Year Built | Square Footage |
GHG Intensity (kg CO2 eq./sqft) |
Total GHG Emissions (tons CO2 eq.) |
|---|---|---|---|---|---|
|
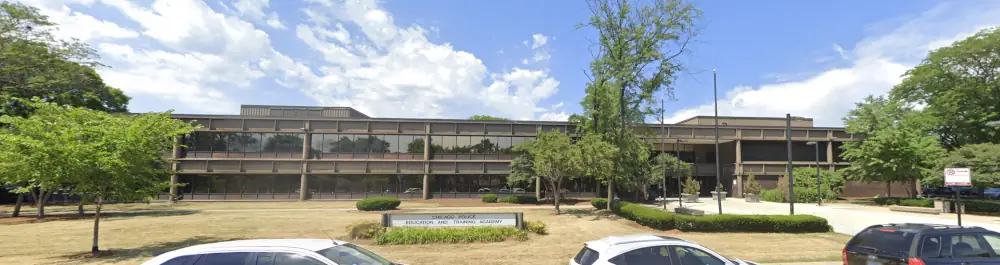
POLICE TRAINING ACADEMY
📷
(Chicago)
C
1300 W. Jackson Blvd.
| Adult Education | 1975 | 180,000 sqft
Highest 35%
| 14.7 kg/sqft
Highest 5%
| 2,637 tons
Highest 15%
|
|
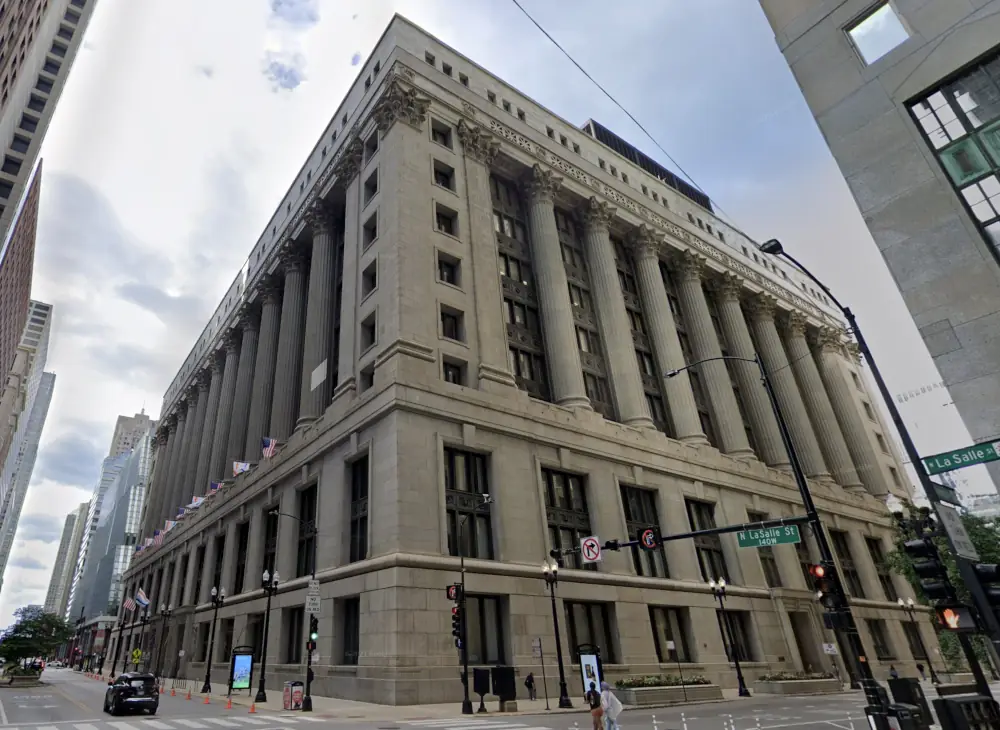
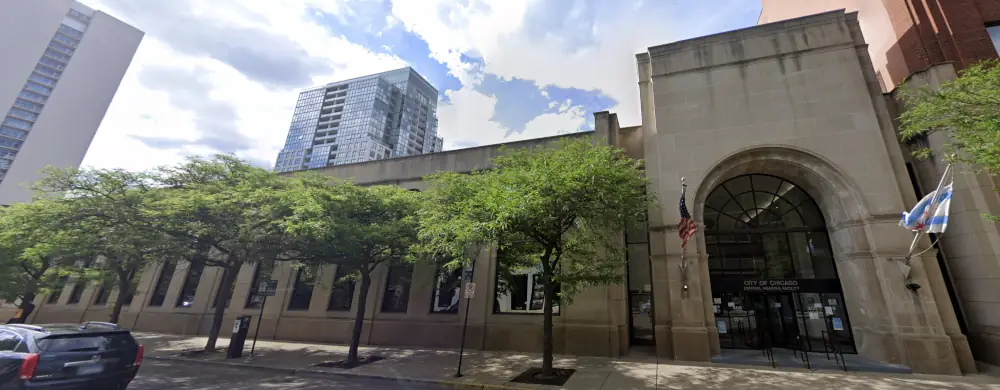
City Hall
📷
(Chicago)
C
121 N. La Salle St.
| Office | 1911 | 411,500 sqft
Highest 14%
| 12.1 kg/sqft
Highest 7%
| 4,967 tons
Highest 6%
|
|
MARTIN LUTHER KING COMMUNITY CENTER
📷
(Chicago)
C
4314 S. Cottage Grove Ave.
| Other - Entertainment/Public Assembly | 1975 | 56,687 sqft
Lowest 8%
| 11.9 kg/sqft
Highest 7%
| 673 tons
Lowest 41%
|
|
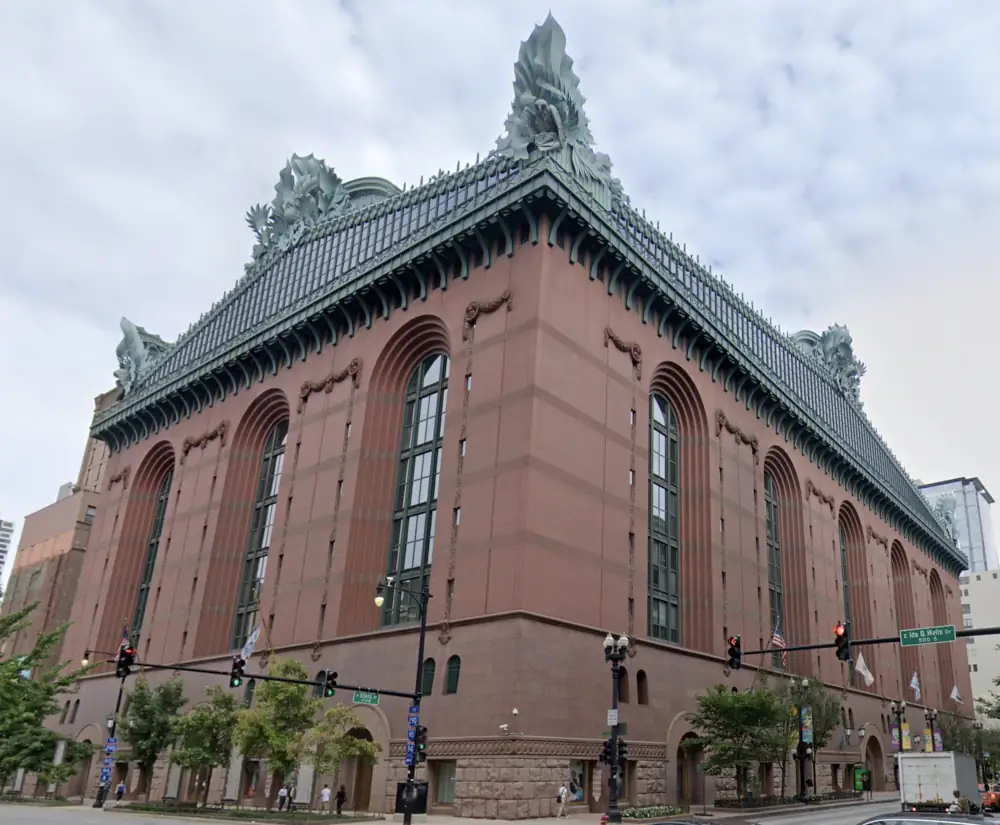
HAROLD WASHINGTON LIBRARY
📷
⚡
(Chicago)
C
400 S. State St.
| Library | 1991 | 756,640 sqft
Highest 6%
| 11.1 kg/sqft
Highest 9%
| 8,380 tons
Highest 3%
|
|
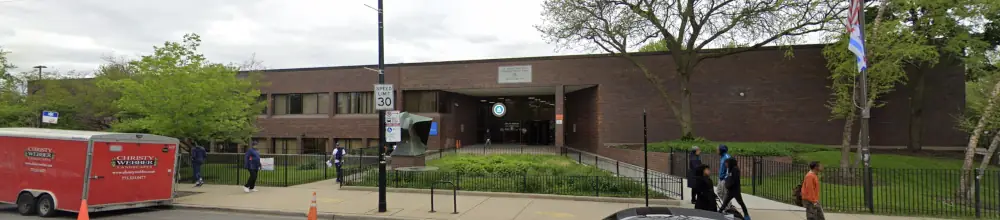
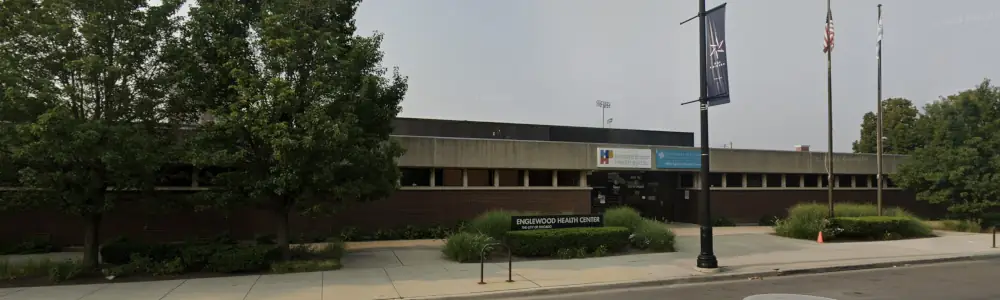
ENGLEWOOD HEALTH CENTER
📷
⚠️
(Chicago)
C
641 W. 63rd St.
| Outpatient Rehabilitation/Physical Therapy | 1972 | 54,189 sqft
Lowest 6%
| 9.5 kg/sqft
Highest 14%
| 513 tons
Lowest 28%
|
|
CDOT Central Office
🕰️
(Chicago)
C
1501 W Pershing Rd
| Office | 1975 | 100,000 sqft | 9.1 kg/sqft | 907 tons |
|
400 W. Superior
📷
(Chicago)
C
400-432 W. Superior Street
| Office | 1998 | 130,007 sqft
Highest 48%
| 8.7 kg/sqft
Highest 18%
| 1,125 tons
Highest 39%
|
|
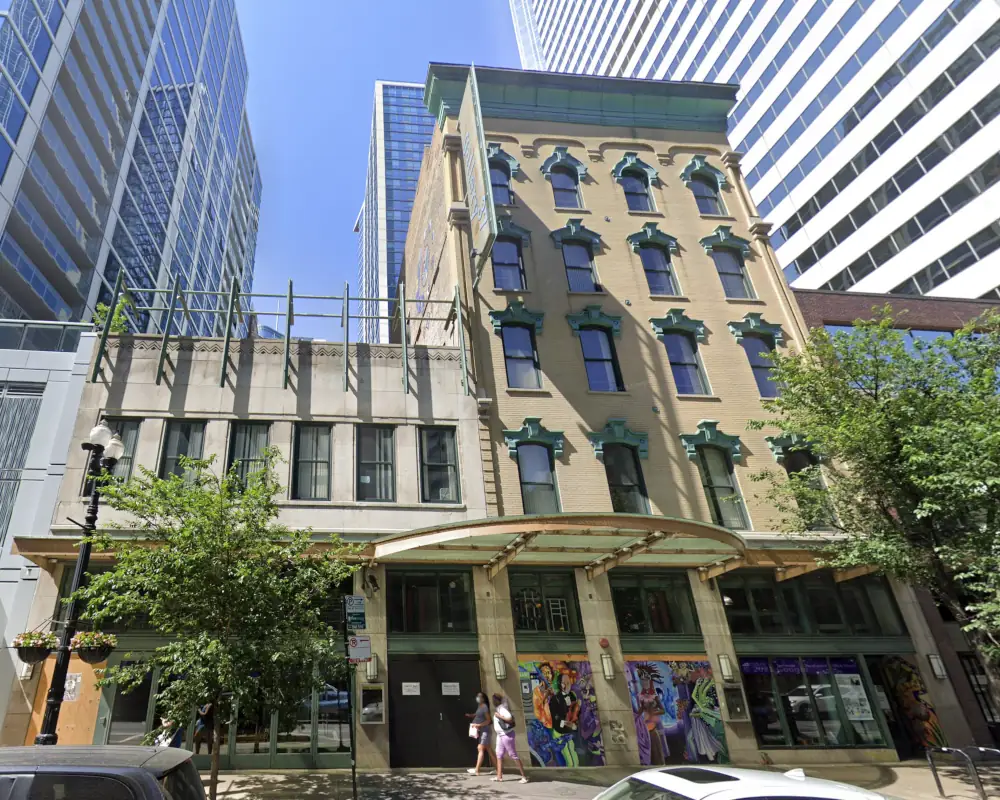
Gallery 37
📷
🕰️
⚠️
(Chicago)
C
66 E Randolph St
| Other - Entertainment/Public Assembly | 1872 | 75,000 sqft | 8.0 kg/sqft | 599 tons |
|
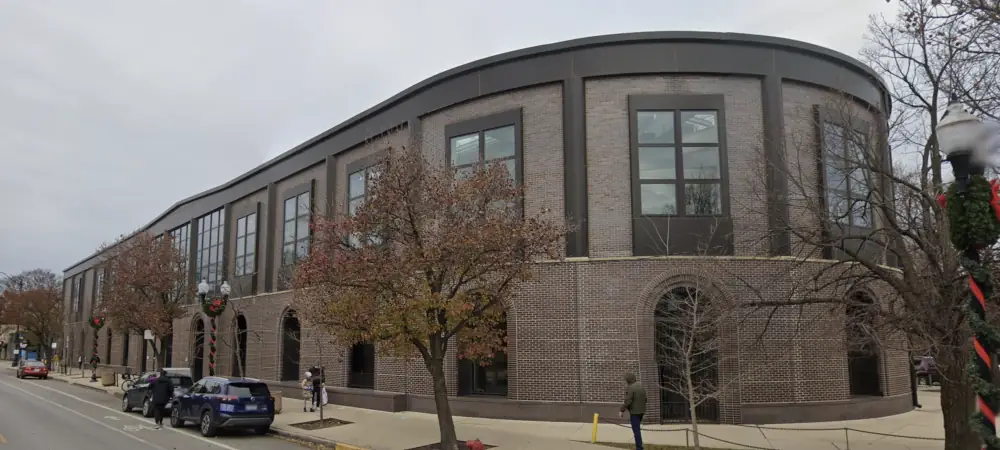
SULZER LIBRARY
📷
(Chicago)
C
4455 N. Lincoln Ave.
| Library | 1985 | 83,000 sqft
Lowest 30%
| 7.4 kg/sqft
Highest 30%
| 610 tons
Lowest 37%
|
Data Source:
Chicago Energy Benchmarking Data