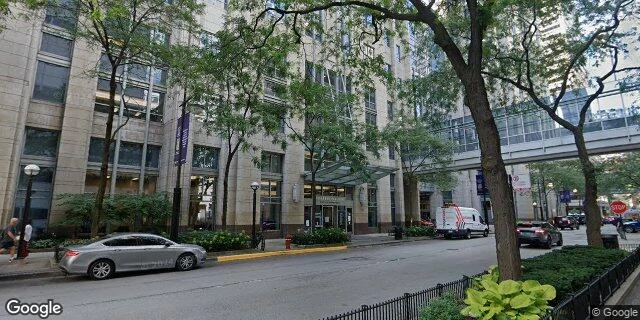
Northwestern University Quick Stats
13
Tagged Buildings
Total Emissions
125,277
metric tons CO2 equivalent
149x the median building (841.4
tons CO2e)
Avg GHG Intensity
19.1
kg CO2e/sqft
3x the median building (6.2
kg CO2/sqft)
Grade Distribution
Total Square Footage
6.6M
million sq ft under management
Avg Building Age
55
years old
Northwestern University Buildings List
Note: Building owners are manually tagged, so this may not be a definitive or perfect list.
Note: Data From Large Buildings in 2023
Note: This data only includes buildings whose emissions
are reported under the
Chicago Energy Benchmarking Ordinance. According to the City “As of 2016, this list includes all
commercial, institutional, and residential buildings larger than 50,000
square feet.”
The latest year of data is from 2023, but we update the site regularly when new data is available, and some buildings may have failed to report that year, and only have older data available.
Additionally, note that all tons specified are metric tons.
| Name / Address | Primary Property Type | Year Built | Square Footage |
GHG Intensity (kg CO2 eq./sqft) |
Total GHG Emissions (tons CO2 eq.) |
|---|---|---|---|---|---|
|
8794
🚩
(Northwestern)
D
320 E Superior St
| Laboratory | 1965 | 186,803 sqft
Highest 35%
| 29.2 kg/sqft #16 Highest
| 5,464 tons
Highest 5%
|
|
NMH Olson Pavilion
⚠️
(Northwestern)
D
710 N Fairbanks Ct
| Laboratory | 1977 | 362,800 sqft
Highest 17%
| 28.6 kg/sqft #18 Highest
| 10,388 tons
Highest 2%
|
|
8846
⚠️
(Northwestern)
C
303 E Superior St
| Laboratory | 2004 | 418,826 sqft
Highest 13%
| 27.0 kg/sqft #20 Highest
| 11,315 tons #45 Highest
|
|
8791
(Northwestern)
D
300 E Superior St
| Laboratory | 1990 | 303,863 sqft
Highest 20%
| 21.8 kg/sqft
Highest 2%
| 6,639 tons
Highest 4%
|
|
8792
(Northwestern)
D
303 E Chicago Ave
| Laboratory | 1925 | 303,490 sqft
Highest 20%
| 19.6 kg/sqft
Highest 2%
| 5,947 tons
Highest 5%
|
|
NMH Feinberg Pavilion and Galter Pavilion
📷
🕰️
⚠️
(Northwestern)
D
251 E Huron St
| Hospital (General Medical & Surgical) | 1999 | 2,200,000 sqft | 19.0 kg/sqft | 41,775 tons |
|
NMH Prentice Womens Hospital
🕰️
(Northwestern)
C
250 E Superior St
| Hospital (General Medical & Surgical) | 2007 | 945,000 sqft | 17.9 kg/sqft | 16,896 tons |
|
8793
(Northwestern)
D
310 E Superior St
| College/University | 1955 | 61,179 sqft
Lowest 13%
| 16.4 kg/sqft
Highest 4%
| 1,001 tons
Highest 43%
|
|
8890
⚠️
(Northwestern)
D
345 E. Superior
| College/University | 1974 | 370,800 sqft
Highest 16%
| 15.9 kg/sqft
Highest 4%
| 5,885 tons
Highest 5%
|
|
8602
⚠️
(Northwestern)
C
710 Lake Shore Dr
| College/University | 1939 | 236,060 sqft
Highest 28%
| 15.3 kg/sqft
Highest 5%
| 3,619 tons
Highest 10%
|
|
NMH Arkes Family Pavilion
(Northwestern)
C
676 N St. Clair St
| Medical Office | 1980 | 675,000 sqft
Highest 7%
| 13.7 kg/sqft
Highest 6%
| 9,274 tons
Highest 2%
|
|
8816
⚠️
(Northwestern)
D
375 E Chicago Ave
| College/University | 1978 | 388,282 sqft
Highest 15%
| 12.7 kg/sqft
Highest 6%
| 4,913 tons
Highest 6%
|
|
8795
(Northwestern)
D
340 E Superior St
| College/University | 1925 | 187,974 sqft
Highest 34%
| 11.5 kg/sqft
Highest 8%
| 2,162 tons
Highest 19%
|
Data Source:
Chicago Energy Benchmarking Data
 Northwestern University