
Data Center Stats
metric tons CO2e
kg CO2e/sqft

All Data Centers
Showing Data Centers buildings that reported their energy use and greenhouse gas emissions to the City of Chicago under energy benchmarking.
Note: Data From Large Buildings in 2023
Note: This data only includes buildings whose emissions
are reported under the
Chicago Energy Benchmarking Ordinance . According to the City “As of 2016, this list includes all
commercial, institutional, and residential buildings larger than 50,000
square feet.”
. According to the City “As of 2016, this list includes all
commercial, institutional, and residential buildings larger than 50,000
square feet.”
The latest year of data is from 2023, but we update the site regularly when new data is available, and some buildings may have failed to report that year, and only have older data available.
Additionally, note that all tons specified are metric tons.
| Name / Address | Primary Property Type | Year Built | Square Footage |
GHG Intensity (kg CO2 eq./sqft) |
Total GHG Emissions (tons CO2 eq.) |
|---|---|---|---|---|---|
|
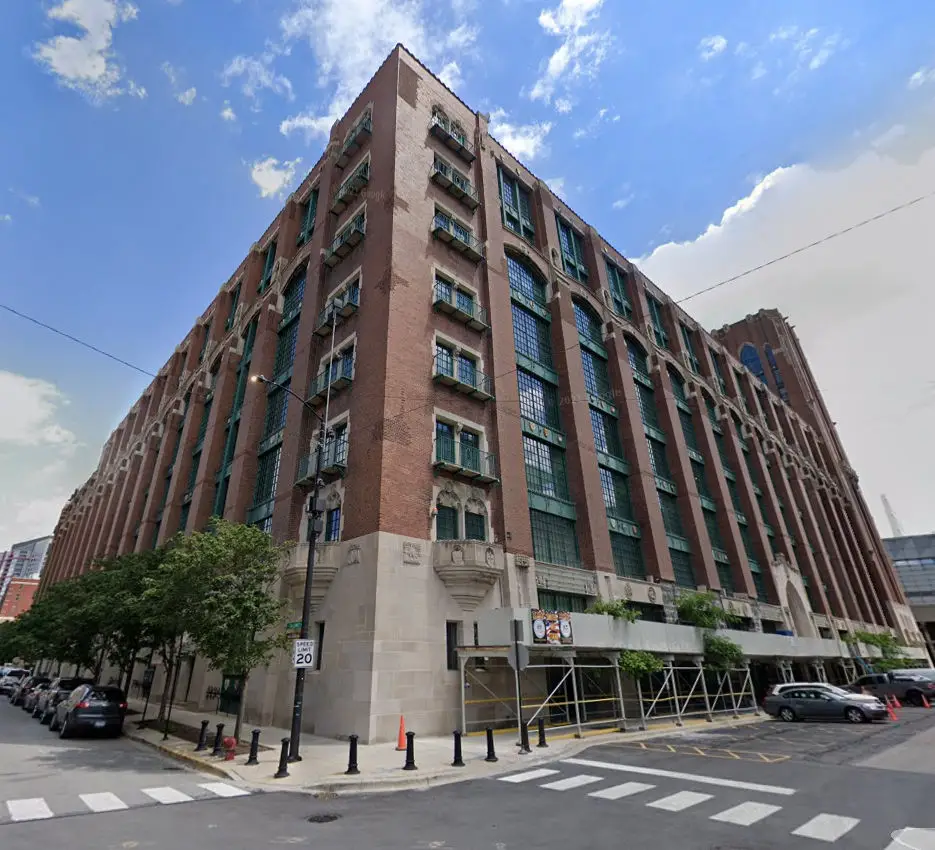
Digital Lakeside
📷
🕰️
C
350 E Cermak
| Data Center | 1912 | 1,262,150 sqft | 142.1 kg/sqft | 173,706 tons |
|
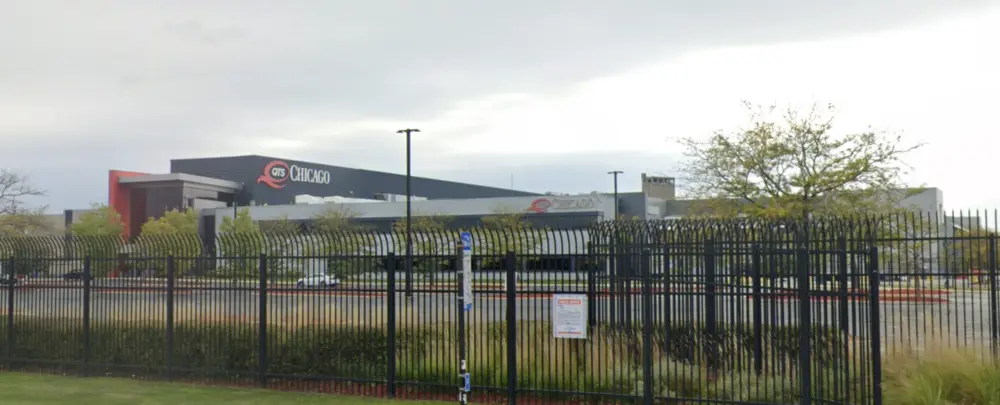
CHI1 - Chicago DC1
🚨
📷
C
2800 S. Ashland Ave
| Data Center | 2001 | 474,979 sqft
Highest 11%
| 101.7 kg/sqft #2 Highest
| 48,295 tons #4 Highest
|
|
Digital Printer's Row
📷
🕰️
C
600 S Federal St
| Data Center | 1912 | 342,883 sqft | 93.5 kg/sqft | 17,324 tons |
|
CH2
C
1432 S. Clinton St
| Data Center | 2020 | 180,000 sqft
Highest 35%
| 17.4 kg/sqft
Highest 3%
| 3,132 tons
Highest 12%
|
|
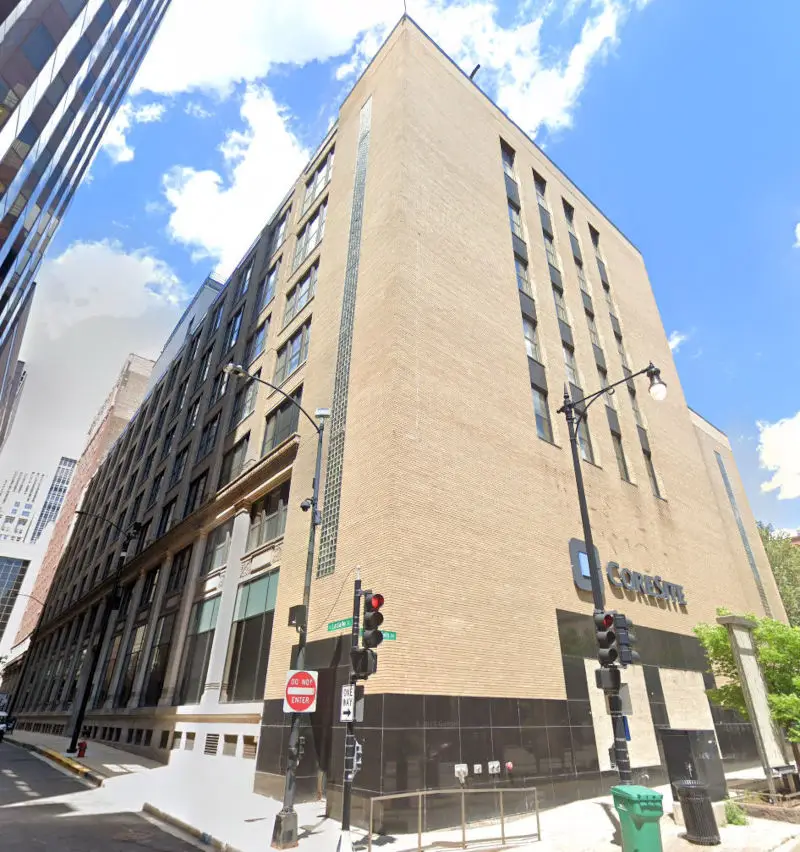
CH1
🚨
📷
⚡
C
427 S. Lasalle`
| Data Center | 1919 | 160,000 sqft
Highest 40%
| 135.1 kg/sqft #1 Highest
| 21,620 tons #10 Highest
|
|
601 West Polk
🚨
⚡
C
601 W Polk St
| Data Center | 1918 | 104,000 sqft
Lowest 42%
| 70.6 kg/sqft #3 Highest
| 7,338 tons
Highest 3%
|
|
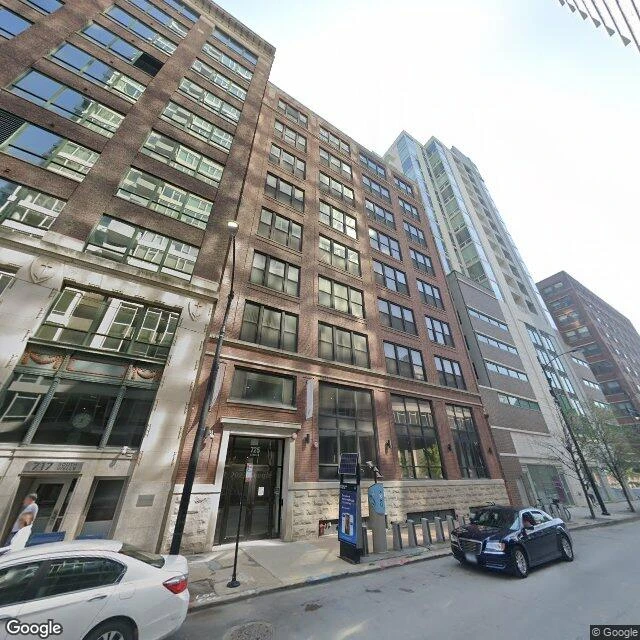
1547 CSR-Chicago Wells, LLC
🚩
📷
C
725 S. Wells
| Data Center | 1909 | 65,904 sqft
Lowest 17%
| 24.6 kg/sqft #31 Highest
| 1,620 tons
Highest 27%
|
Data Source:
Chicago Energy Benchmarking Data