
Mixed Use Property Stats
metric tons CO2e
kg CO2e/sqft

All Mixed Use Property Buildings
Showing Mixed Use Property Buildings buildings that reported their energy use and greenhouse gas emissions to the City of Chicago under energy benchmarking.
Note: Data From Large Buildings in 2023
Note: This data only includes buildings whose emissions
are reported under the
Chicago Energy Benchmarking Ordinance . According to the City “As of 2016, this list includes all
commercial, institutional, and residential buildings larger than 50,000
square feet.”
. According to the City “As of 2016, this list includes all
commercial, institutional, and residential buildings larger than 50,000
square feet.”
The latest year of data is from 2023, but we update the site regularly when new data is available, and some buildings may have failed to report that year, and only have older data available.
Additionally, note that all tons specified are metric tons.
| Name / Address | Primary Property Type | Year Built | Square Footage |
GHG Intensity (kg CO2 eq./sqft) |
Total GHG Emissions (tons CO2 eq.) |
|---|---|---|---|---|---|
|
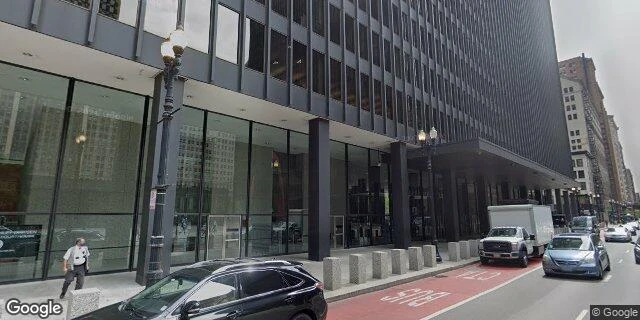
IL0000FC-CHICAGO FEDERAL CTR
🚩
📷
B
219 S Dearborn
| Mixed Use Property | 1975 | 3,176,860 sqft #6 Highest
| 5.5 kg/sqft
Lowest 36%
| 17,419 tons #20 Highest
|
|
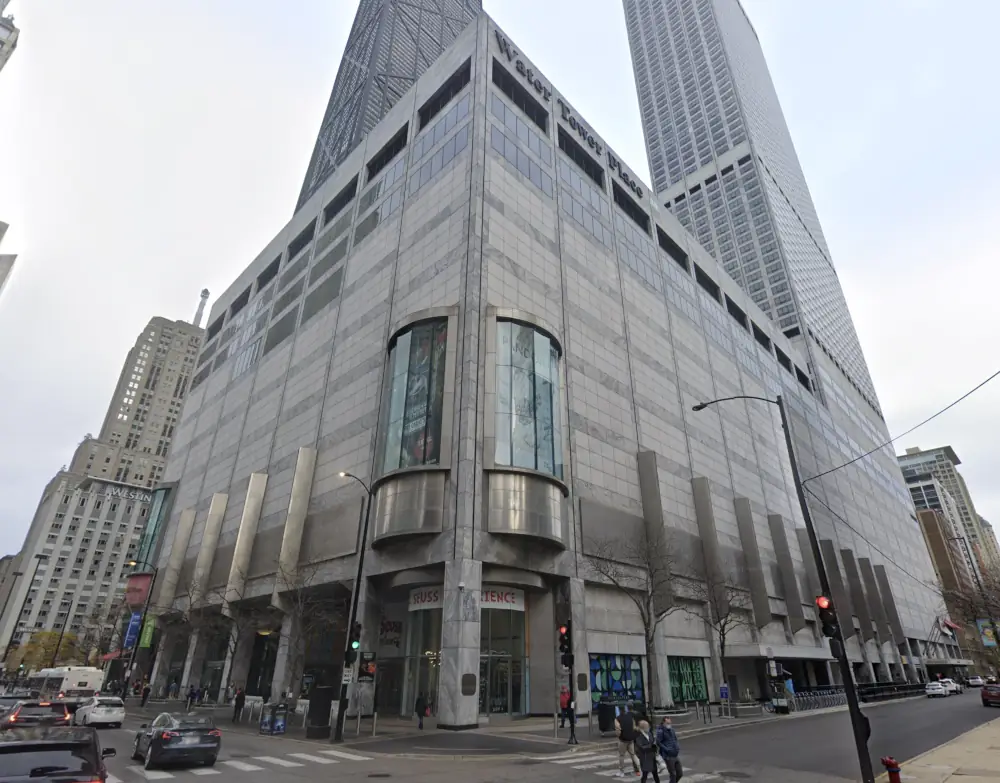
Water Tower Place
🚨
📷
C
835 N. Michigan Avenue
| Mixed Use Property | 1976 | 2,581,145 sqft #10 Highest
| 8.8 kg/sqft
Highest 18%
| 22,605 tons #9 Highest
|
|
The John Hancock Center
🚨
📷
⚡
C
875 N Michigan Ave
| Mixed Use Property | 1970 | 2,290,873 sqft #14 Highest
| 10.0 kg/sqft
Highest 12%
| 22,818 tons #8 Highest
|
|
900 North Michigan
🚩
📷
C
900 North Michigan
| Mixed Use Property | 1989 | 2,136,748 sqft #15 Highest
| 9.9 kg/sqft
Highest 12%
| 21,211 tons #11 Highest
|
|
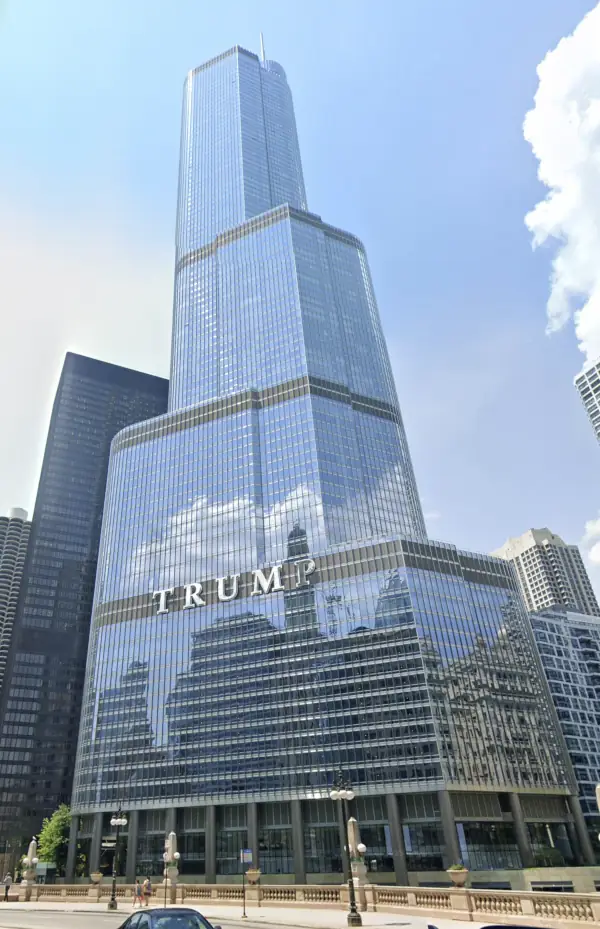
Trump
🚩
📷
B
401 N. Wabash
| Mixed Use Property | 2008 | 2,125,888 sqft #16 Highest
| 7.3 kg/sqft
Highest 31%
| 15,427 tons #25 Highest
|
|
Roosevelt Collection
📷
🕰️
A
150 W Roosevelt Rd
| Mixed Use Property | 2009 | 1,686,996 sqft | 4.6 kg/sqft | 4,991 tons |
|
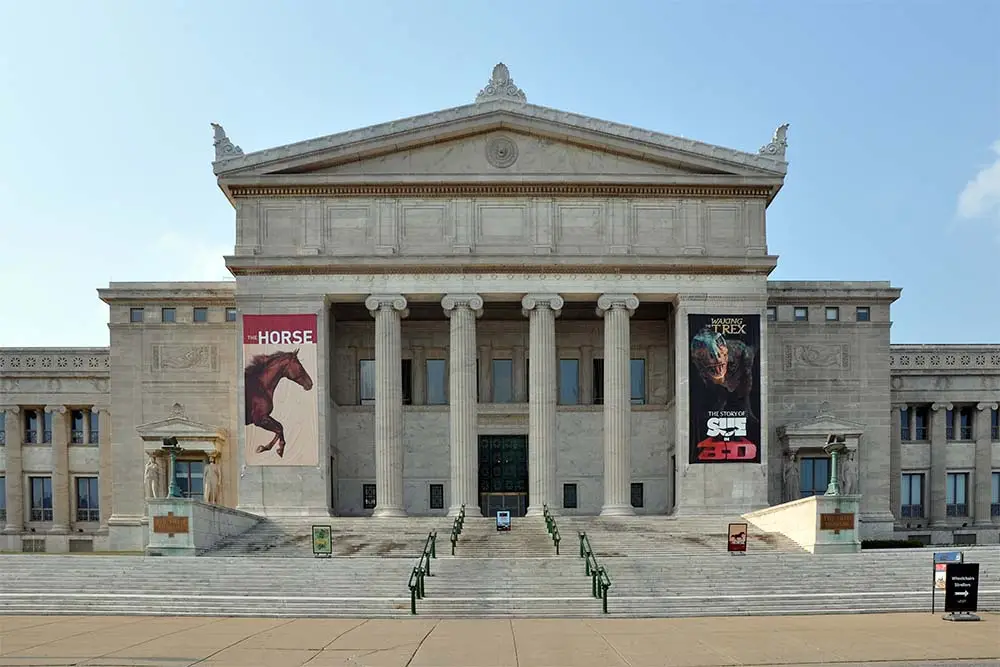
The Field Museum
🚩
📷
D
1400 South Lake Shore Drive
| Mixed Use Property | 1921 | 1,280,537 sqft
Highest 2%
| 11.3 kg/sqft
Highest 8%
| 14,449 tons #32 Highest
|
|
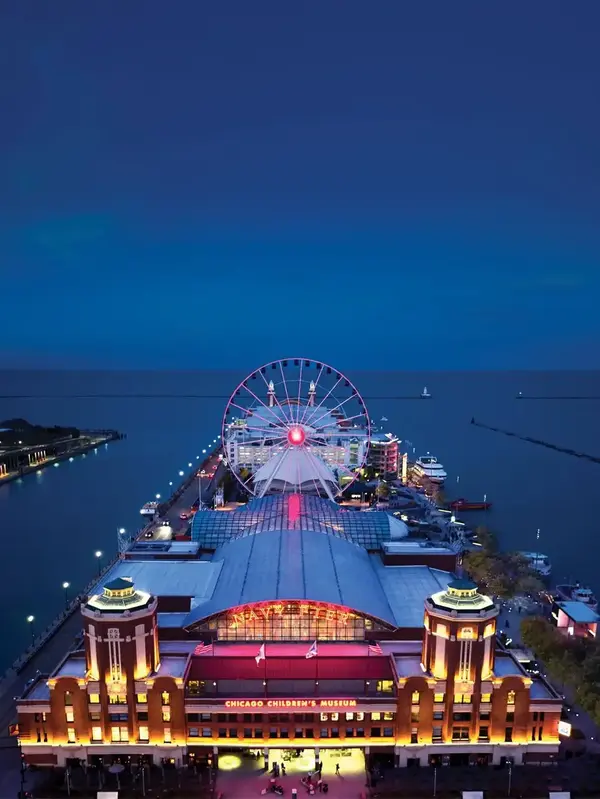
Navy Pier, Inc.
🚩
📷
C
600 E Grand Ave
| Mixed Use Property | 1914 | 1,150,000 sqft
Highest 3%
| 13.3 kg/sqft
Highest 6%
| 15,325 tons #26 Highest
|
|
Roosevelt Collection (rs314)
📷
A
1135 S Delano Ct E
| Mixed Use Property | 2010 | 1,095,338 sqft
Highest 3%
| 4.5 kg/sqft
Lowest 17%
| 4,896 tons
Highest 6%
|
|
Olympia Centre
⚡
C
737 N Michigan
| Mixed Use Property | 1984 | 1,060,961 sqft
Highest 3%
| 8.6 kg/sqft
Highest 19%
| 9,091 tons
Highest 2%
|
|
Juvenile Temporary Detention Center Campus
📷
C
1100 S. Hamilton Ave.
| Mixed Use Property | 1973 | 1,023,851 sqft
Highest 3%
| 7.8 kg/sqft
Highest 25%
| 7,954 tons
Highest 3%
|
|
One Magnificent Mile
⚡
B
980 North Michigan Avenue
| Mixed Use Property | 1983 | 1,017,675 sqft
Highest 3%
| 6.7 kg/sqft
Highest 40%
| 6,840 tons
Highest 4%
|
|
River City
B
800 S. Wells Street
| Mixed Use Property | 1986 | 993,312 sqft
Highest 4%
| 5.7 kg/sqft
Lowest 41%
| 5,621 tons
Highest 5%
|
|
Swedish Hospital Campus
🚩
C
5145 North California
| Mixed Use Property | 1918 | 799,492 sqft
Highest 5%
| 20.5 kg/sqft
Highest 2%
| 16,427 tons #23 Highest
|
|
Misericordia Home
C
6300 N. Ridge Ave.
| Mixed Use Property | 1950 | 717,710 sqft
Highest 6%
| 8.7 kg/sqft
Highest 18%
| 6,211 tons
Highest 5%
|
|
Gold Coast Galleria
⚠️
B
111 West Maple Street
| Mixed Use Property | 1991 | 462,140 sqft
Highest 12%
| 7.0 kg/sqft
Highest 35%
| 3,232 tons
Highest 11%
|
|
Wilson Yard
B
1026-1032 W Montrose
| Mixed Use Property | 2010 | 415,976 sqft
Highest 14%
| 6.0 kg/sqft
Lowest 47%
| 2,491 tons
Highest 16%
|
|
100 E Walton St
⚠️
C
100 E Walton St
| Mixed Use Property | 1971 | 367,703 sqft
Highest 16%
| 7.6 kg/sqft
Highest 27%
| 2,780 tons
Highest 14%
|
|
630 North Rush
🕰️
⚠️
B
630 North Rush
| Mixed Use Property | 2005 | 320,717 sqft | 8.6 kg/sqft | 2,768 tons |
|
Ascension SMEMC St Elizabeth Campus
D
1431 North Claremont Ave
| Mixed Use Property | 1928 | 309,056 sqft
Highest 20%
| 14.0 kg/sqft
Highest 5%
| 4,332 tons
Highest 8%
|
|
26810_26811 939 North Avenue Collection,LLC
⚡
B
939 W. North Avenue
| Mixed Use Property | 2002 | 219,651 sqft
Highest 30%
| 7.1 kg/sqft
Highest 34%
| 1,570 tons
Highest 28%
|
|
Piper's Alley
⚠️
C
230 W. North Avenue
| Mixed Use Property | 1977 | 219,532 sqft
Highest 30%
| 10.4 kg/sqft
Highest 11%
| 2,274 tons
Highest 18%
|
|
St. Mary of Providence
B
4200 N. Austin Ave
| Mixed Use Property | 1939 | 193,381 sqft
Highest 34%
| 4.9 kg/sqft
Lowest 24%
| 943 tons
Highest 45%
|
|
Bernard Horwich JCC
C
3003 Touhy Ave
| Mixed Use Property | 1950 | 166,000 sqft
Highest 38%
| 7.4 kg/sqft
Highest 30%
| 1,224 tons
Highest 36%
|
|
Aberdeen
C
171 N. Aberdeen St
| Mixed Use Property | 2018 | 155,000 sqft
Highest 41%
| 6.3 kg/sqft
Highest 47%
| 972 tons
Highest 45%
|
|
Sullivan Center-ID# 173858
⚡
(Loyola)
B
6339 N Sheridan Rd
| Mixed Use Property | 1967 | 130,027 sqft
Highest 48%
| 7.3 kg/sqft
Highest 31%
| 947 tons
Highest 45%
|
|
La Plaza Hubbard 1812, LLC
🏆
B
1812-1840 Hubbard Street
| Mixed Use Property | 1914 | 121,398 sqft
Lowest 49%
| 2.7 kg/sqft
#21 Lowest in Chicago*
| 326 tons
Lowest 11%
|
|
832 854 W FULTON MARKET
🕰️
D
832 854 W FULTON MARKET
| Mixed Use Property | 2017 | 118,640 sqft | 22.8 kg/sqft | 2,201 tons |
|
Center on Halsted
C
3656 N Halsted
| Mixed Use Property | 2007 | 103,640 sqft
Lowest 41%
| 22.0 kg/sqft
Highest 2%
| 2,282 tons
Highest 18%
|
|
Lincoln Park Commons Condominium Association
🕰️
⚠️
D
2650-2700 N. Clark St.
| Mixed Use Property | 2003 | 103,000 sqft | 14.0 kg/sqft | 1,445 tons |
|
1550 S Indiana
A
1550 S Indiana
| Mixed Use Property | 1910 | 90,000 sqft
Lowest 34%
| 3.6 kg/sqft
Lowest 5%
| 326 tons
Lowest 11%
|
|
Elston Industrial lofts, Llc
⚠️
B
1737-1747 N Elston/ 1430-1454 W Willow
| Mixed Use Property | 1923 | 83,832 sqft
Lowest 31%
| 5.6 kg/sqft
Lowest 38%
| 473 tons
Lowest 25%
|
|
Lurie Children's Lincoln Park Outpatient Center - Deming
🕰️
C
467 W Deming Pl
| Mixed Use Property | 1972 | 80,877 sqft | 25.8 kg/sqft | 1,623 tons |
|
1308 N Elston Avenue
⚡
B
1308 N Elston
| Mixed Use Property | 1914 | 77,159 sqft
Lowest 26%
| 7.3 kg/sqft
Highest 31%
| 566 tons
Lowest 33%
|
|
MLL 1945 Wilson, LLC
⚠️
B
1945 W. Wilson Ave.
| Mixed Use Property | 1979 | 68,070 sqft
Lowest 20%
| 6.5 kg/sqft
Highest 44%
| 443 tons
Lowest 22%
|
|
4141 W George
🕰️
C
4141 W George St.
| Mixed Use Property | 1942 | 64,860 sqft | 5.9 kg/sqft | 385 tons |
|
Lawndale Christian Health and Fitness Center
⚠️
B
3748 W Ogden Avenue
| Mixed Use Property | 2012 | 64,779 sqft
Lowest 16%
| 7.1 kg/sqft
Highest 34%
| 462 tons
Lowest 24%
|
|
Flanner Hall-ID# 158842
⚠️
(Loyola)
C
1068 W Sheridan Rd
| Mixed Use Property | 1976 | 64,407 sqft
Lowest 16%
| 16.7 kg/sqft
Highest 4%
| 1,075 tons
Highest 41%
|
|
MetraMarket of Chicago
🕰️
D
118 N. Canal Street
| Mixed Use Property | 2006 | 62,792 sqft | 37.4 kg/sqft | 2,350 tons |
|
DANK Haus German American Cultural Center
🕰️
⚠️
B
4740 N Western Ave
| Mixed Use Property | 1927 | 61,042 sqft | 3.4 kg/sqft | 208 tons |
|
Red Shield Center
C
945 W. 69th St.
| Mixed Use Property | 2006 | 50,000 sqft
#17 Lowest in Chicago*
| 9.4 kg/sqft
Highest 14%
| 472 tons
Lowest 25%
|
Data Source:
Chicago Energy Benchmarking Data