

Museum Stats
metric tons CO2e
kg CO2e/sqft

All Museum Buildings
Showing Museum Buildings buildings that reported their energy use and greenhouse gas emissions to the City of Chicago under energy benchmarking.
Note: Data From Large Buildings in 2023
Note: This data only includes buildings whose emissions
are reported under the
Chicago Energy Benchmarking Ordinance . According to the City “As of 2016, this list includes all
commercial, institutional, and residential buildings larger than 50,000
square feet.”
. According to the City “As of 2016, this list includes all
commercial, institutional, and residential buildings larger than 50,000
square feet.”
The latest year of data is from 2023, but we update the site regularly when new data is available, and some buildings may have failed to report that year, and only have older data available.
Additionally, note that all tons specified are metric tons.
| Name / Address | Primary Property Type | Year Built | Square Footage |
GHG Intensity (kg CO2 eq./sqft) |
Total GHG Emissions (tons CO2 eq.) |
|---|---|---|---|---|---|
|
Griffin Museum of Science and Industry
📷
A
5700 South Lake Shore Drive
| Museum | 1893 | 1,300,000 sqft #48 Highest
| 4.9 kg/sqft
Lowest 24%
| 6,355 tons
Highest 4%
|
|
The Art Institute of Chicago
🚩
📷
D
111 South Michigan Ave
| Museum | 1892 | 1,008,416 sqft
Highest 3%
| 16.3 kg/sqft
Highest 4%
| 16,445 tons #22 Highest
|
|
Chicago Historical Society
🕰️
⚠️
D
1601 N Clark Street
| Museum | 1932 | 270,160 sqft | 18.8 kg/sqft | 5,074 tons |
|
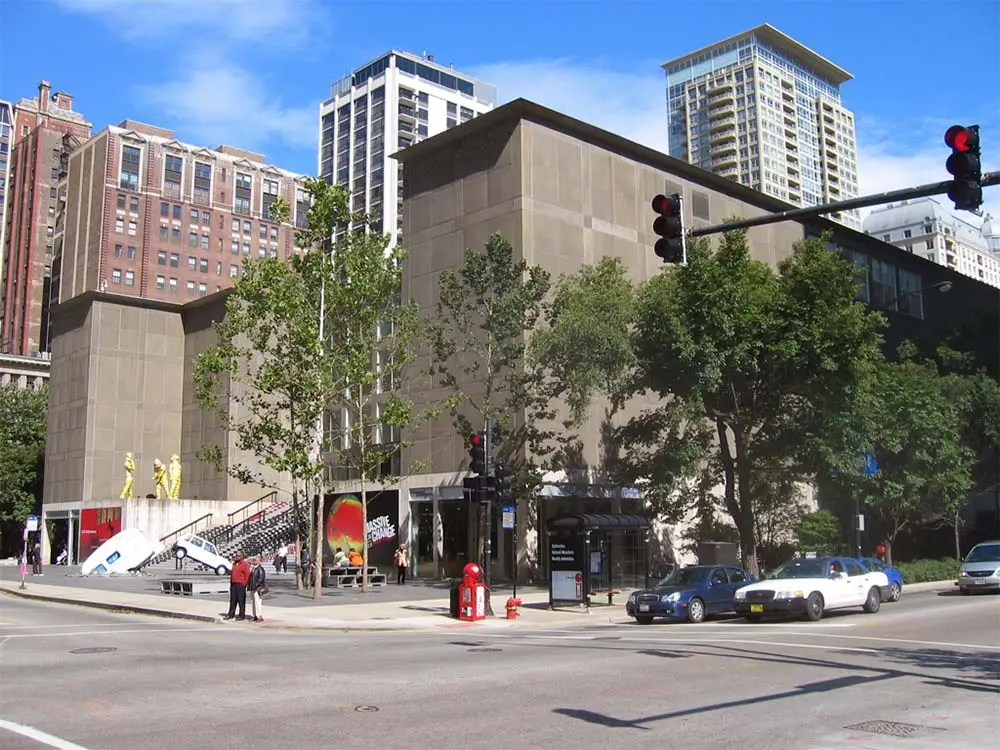
Museum of Contemporary Art
📷
⚠️
C
220 E. Chicago Avenue
| Museum | 1996 | 233,286 sqft
Highest 28%
| 10.5 kg/sqft
Highest 10%
| 2,443 tons
Highest 16%
|
|
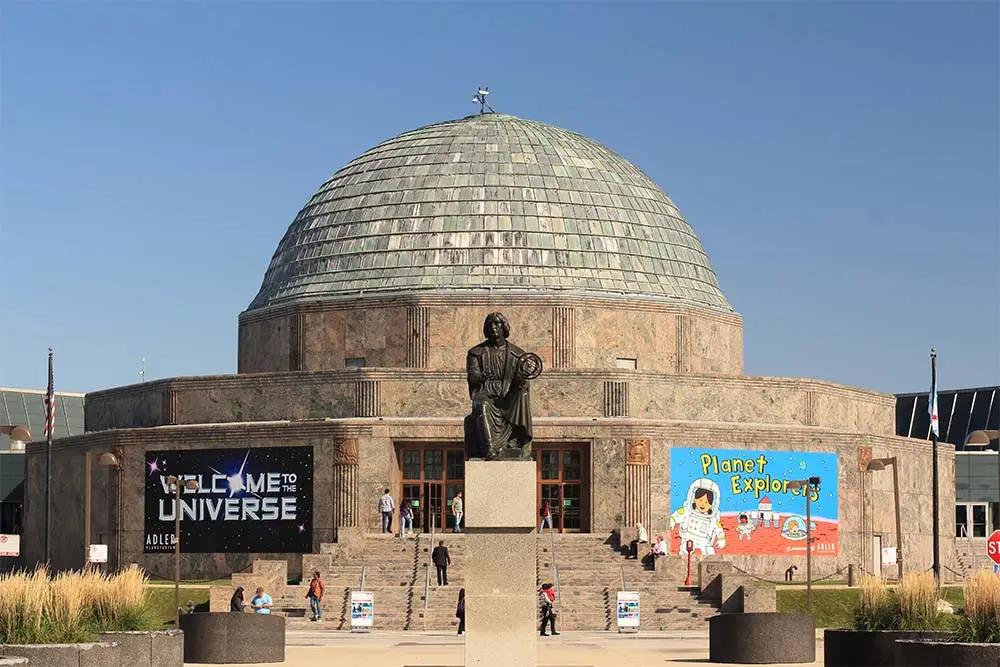
Adler Planetarium
📷
⚠️
C
1300 S. Lake Shore Dr.
| Museum | 1930 | 175,000 sqft
Highest 37%
| 10.1 kg/sqft
Highest 12%
| 1,774 tons
Highest 25%
|
|
Washington Park Fieldhouse, Trades, DuSable Roundhouse
🕰️
⚠️
D
5531 South King Drive
| Museum | 1910 | 122,439 sqft | 26.2 kg/sqft | 3,211 tons |
|
Polish Roman Catholic Union of America
🕰️
B
984 N MILWAUKEE AVE
| Museum | 1912 | 52,400 sqft | 5.4 kg/sqft | 285 tons |
Data Source:
Chicago Energy Benchmarking Data