Other Stats
metric tons CO2e
kg CO2e/sqft

All Other Buildings
Showing Other Buildings buildings that reported their energy use and greenhouse gas emissions to the City of Chicago under energy benchmarking.
Note: Data From Large Buildings in 2023
Note: This data only includes buildings whose emissions
are reported under the
Chicago Energy Benchmarking Ordinance . According to the City “As of 2016, this list includes all
commercial, institutional, and residential buildings larger than 50,000
square feet.”
. According to the City “As of 2016, this list includes all
commercial, institutional, and residential buildings larger than 50,000
square feet.”
The latest year of data is from 2023, but we update the site regularly when new data is available, and some buildings may have failed to report that year, and only have older data available.
Additionally, note that all tons specified are metric tons.
| Name / Address | Primary Property Type | Year Built | Square Footage |
GHG Intensity (kg CO2 eq./sqft) |
Total GHG Emissions (tons CO2 eq.) |
|---|---|---|---|---|---|
|
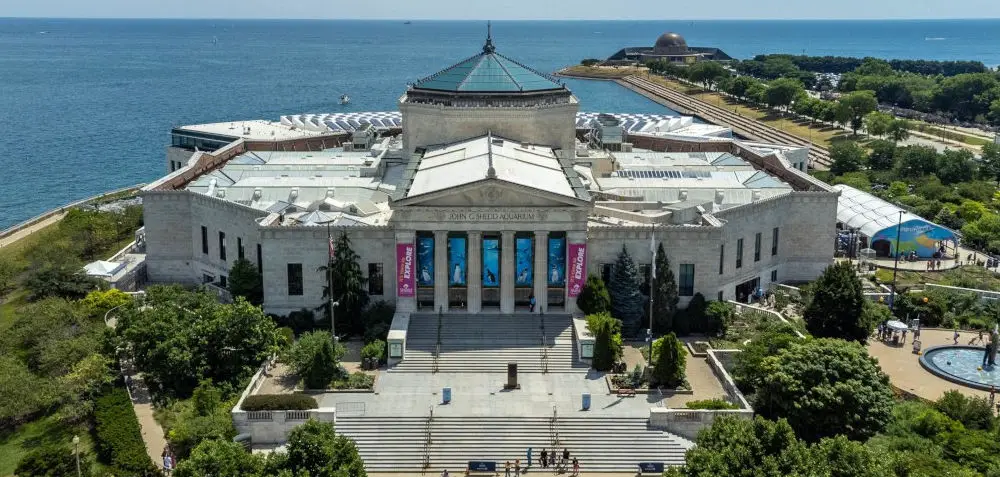
John G Shedd Aquarium
📷
C
1200 South Lake Shore Drive
| Other | 1929 | 452,756 sqft
Highest 12%
| 19.6 kg/sqft
Highest 2%
| 8,864 tons
Highest 3%
|
|
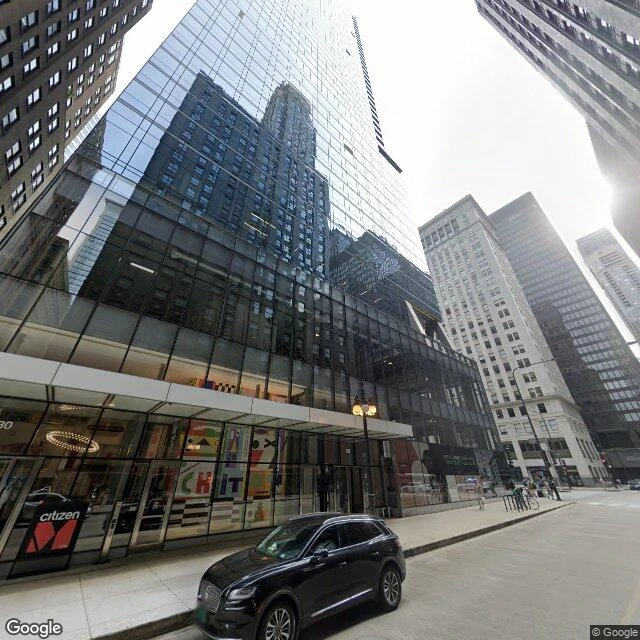
300 N Michigan
📷
A
300 N Michigan
| Other | 2021 | 433,000 sqft
Highest 13%
| 4.4 kg/sqft
Lowest 15%
| 1,914 tons
Highest 23%
|
|
Bradley Business Center II
⚠️
A
2500 West Bradley Place
| Other | 1956 | 374,000 sqft
Highest 16%
| 3.8 kg/sqft
Lowest 7%
| 1,431 tons
Highest 31%
|
|
Northwest Armory
B
1551 North Kedzie
| Other | 1940 | 204,256 sqft
Highest 32%
| 5.0 kg/sqft
Lowest 26%
| 1,025 tons
Highest 42%
|
|
Holy Name Cathedral Parish
🕰️
C
735 N State St
| Other | 1815 | 193,226 sqft | 7.7 kg/sqft | 1,488 tons |
|
Taylor Park
🏆
B
41 W 47th St
| Other | 1964 | 150,000 sqft
Highest 42%
| 1.8 kg/sqft
#6 Lowest in Chicago*
| 276 tons
Lowest 6%
|
|
Dearborn Station
C
47 W. Polk Street
| Other | 1885 | 145,809 sqft
Highest 44%
| 6.9 kg/sqft
Highest 36%
| 1,012 tons
Highest 43%
|
|
Workshop 4200
C
4200 W Diversey
| Other | 1941 | 141,071 sqft
Highest 45%
| 6.2 kg/sqft
Highest 49%
| 881 tons
Highest 48%
|
|
Parish_StMaryStaroftheSea
🕰️
⚠️
C
6449 S. Kilbourn Ave.
| Other | 1950 | 118,820 sqft | 6.6 kg/sqft | 783 tons |
|
Halsted Pershing
🕰️
B
815 W. Pershing Rd.
| Other | 2009 | 104,008 sqft | 5.9 kg/sqft | 617 tons |
|
Saint Hedwig Parish
🕰️
⚠️
C
2226 N Hoyne Ave
| Other | 1950 | 100,888 sqft | 6.1 kg/sqft | 617 tons |
|
4039-43 N Ravenswood LLC
⚠️
A
4043 N Ravenswood
| Other | 1910 | 90,000 sqft
Lowest 34%
| 3.2 kg/sqft
Lowest 2%
| 286 tons
Lowest 7%
|
|
919 S California Ave.
⚠️
C
919 S California Avenue
| Other | 2002 | 85,000 sqft
Lowest 32%
| 10.9 kg/sqft
Highest 9%
| 927 tons
Highest 46%
|
|
Gary Comer Youth Center
B
7200 South Ingleside
| Other | 2006 | 80,000 sqft
Lowest 28%
| 7.0 kg/sqft
Highest 35%
| 558 tons
Lowest 33%
|
|
4001 N. Ravenswood LLC
A
4001 N Ravenswood
| Other | 2008 | 76,800 sqft
Lowest 26%
| 3.2 kg/sqft
Lowest 2%
| 247 tons
Lowest 4%
|
|
Kinzie State Condo Association
⚠️
D
360 N State
| Other | 1929 | 75,940 sqft
Lowest 26%
| 10.1 kg/sqft
Highest 12%
| 769 tons
Lowest 47%
|
|
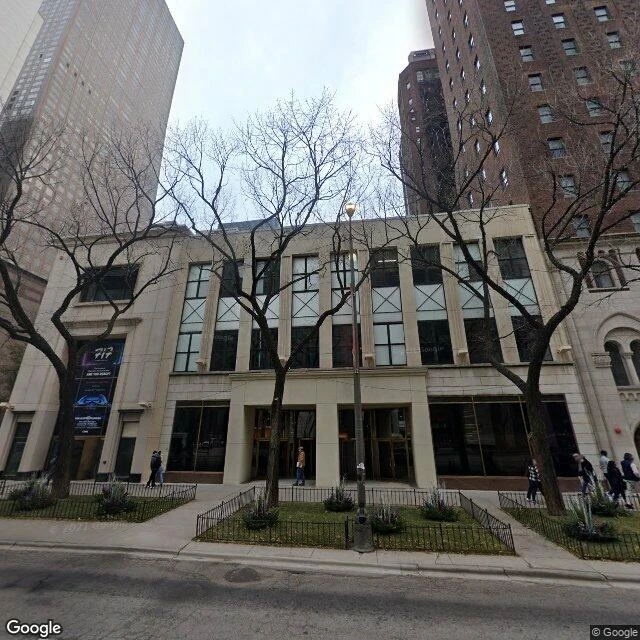
717 N Michigan Avenue
📷
⚠️
D
717 N Michigan Avenue
| Other | 1965 | 61,612 sqft
Lowest 13%
| 6.6 kg/sqft
Highest 42%
| 405 tons
Lowest 19%
|
|
Advocate Center, Chicago Bulls Training Facility
C
15 S. Wood Street
| Other | 2014 | 60,000 sqft
Lowest 12%
| 16.0 kg/sqft
Highest 4%
| 960 tons
Highest 45%
|
|
2641 West Harrison
C
2641 W. Harrison Street
| Other | 2007 | 55,754 sqft
Lowest 7%
| 11.0 kg/sqft
Highest 9%
| 613 tons
Lowest 37%
|
|
CP2, LLC
🕰️
⚠️
C
225 W Hubbard St
| Other | 1925 | 55,000 sqft | 7.2 kg/sqft | 394 tons |
|
Mitchell Tower
⚠️
D
1131 East 57th Street
| Other | 1903 | 2,804 sqft
#1 Lowest in Chicago*
| 20.2 kg/sqft
Highest 2%
| 57 tons
#1 Lowest in Chicago*
|
Data Source:
Chicago Energy Benchmarking Data