Other - Entertainment/Public Assembly Stats
metric tons CO2e
kg CO2e/sqft

All Other - Entertainment/Public Assembly Buildings
Showing Other - Entertainment/Public Assembly Buildings buildings that reported their energy use and greenhouse gas emissions to the City of Chicago under energy benchmarking.
Note: Data From Large Buildings in 2023
Note: This data only includes buildings whose emissions
are reported under the
Chicago Energy Benchmarking Ordinance . According to the City “As of 2016, this list includes all
commercial, institutional, and residential buildings larger than 50,000
square feet.”
. According to the City “As of 2016, this list includes all
commercial, institutional, and residential buildings larger than 50,000
square feet.”
The latest year of data is from 2023, but we update the site regularly when new data is available, and some buildings may have failed to report that year, and only have older data available.
Additionally, note that all tons specified are metric tons.
| Name / Address | Primary Property Type | Year Built | Square Footage |
GHG Intensity (kg CO2 eq./sqft) |
Total GHG Emissions (tons CO2 eq.) |
|---|---|---|---|---|---|
|
Chicago Cultural Center
⚠️
C
78 E. Washington St.
| Other - Entertainment/Public Assembly | 1897 | 240,000 sqft
Highest 27%
| 6.9 kg/sqft
Highest 36%
| 1,665 tons
Highest 26%
|
|
Harpo Studios
🕰️
C
110 N Carpenter
| Other - Entertainment/Public Assembly | 1875 | 132,726 sqft | 18.7 kg/sqft | 2,480 tons |
|
Ida Noyes Hall
D
1212 East 59th Street
| Other - Entertainment/Public Assembly | 1916 | 91,970 sqft
Lowest 35%
| 8.9 kg/sqft
Highest 17%
| 823 tons
Lowest 49%
|
|
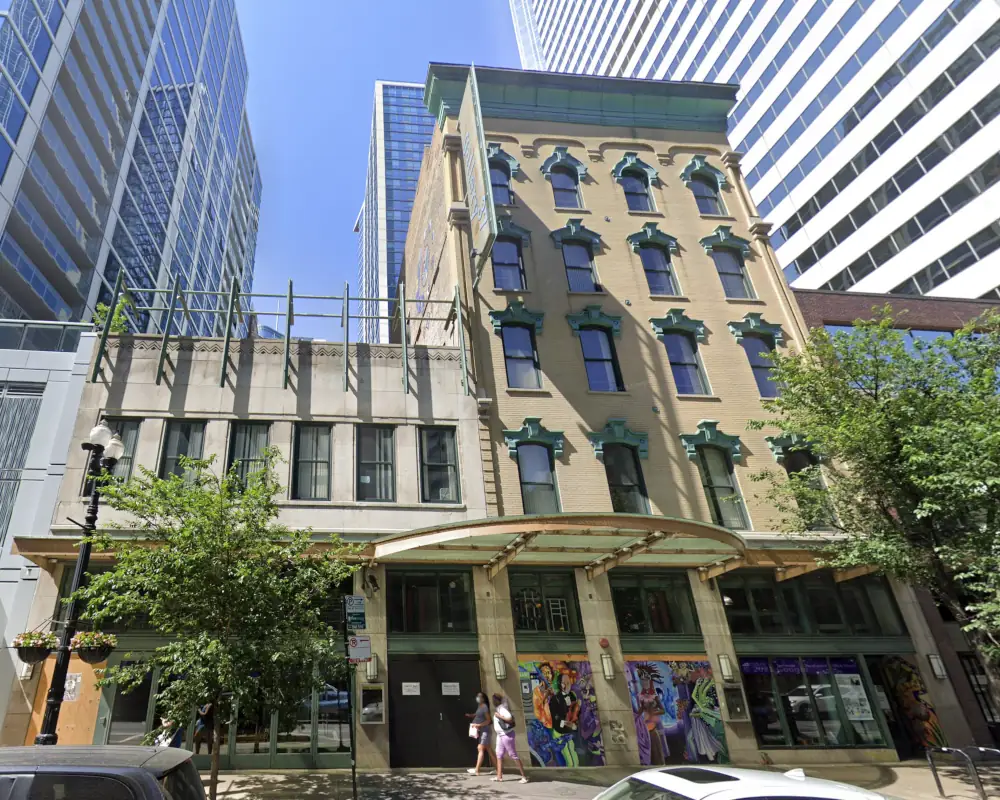
Gallery 37
📷
🕰️
⚠️
(Chicago)
C
66 E Randolph St
| Other - Entertainment/Public Assembly | 1872 | 75,000 sqft | 8.0 kg/sqft | 599 tons |
|
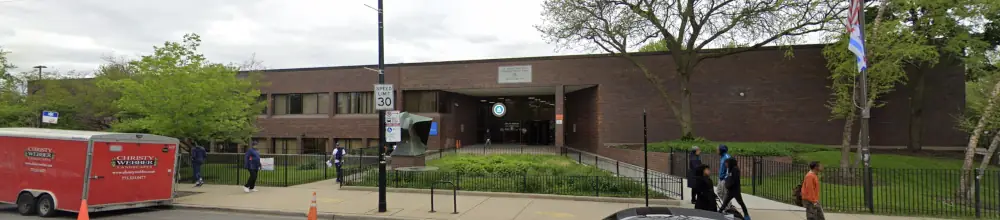
MARTIN LUTHER KING COMMUNITY CENTER
📷
(Chicago)
C
4314 S. Cottage Grove Ave.
| Other - Entertainment/Public Assembly | 1975 | 56,687 sqft
Lowest 8%
| 11.9 kg/sqft
Highest 7%
| 673 tons
Lowest 41%
|
Data Source:
Chicago Energy Benchmarking Data