Other - Recreation Stats
metric tons CO2e
kg CO2e/sqft

All Other - Recreation Buildings
Showing Other - Recreation Buildings buildings that reported their energy use and greenhouse gas emissions to the City of Chicago under energy benchmarking.
Note: Data From Large Buildings in 2023
Note: This data only includes buildings whose emissions
are reported under the
Chicago Energy Benchmarking Ordinance . According to the City “As of 2016, this list includes all
commercial, institutional, and residential buildings larger than 50,000
square feet.”
. According to the City “As of 2016, this list includes all
commercial, institutional, and residential buildings larger than 50,000
square feet.”
The latest year of data is from 2023, but we update the site regularly when new data is available, and some buildings may have failed to report that year, and only have older data available.
Additionally, note that all tons specified are metric tons.
| Name / Address | Primary Property Type | Year Built | Square Footage |
GHG Intensity (kg CO2 eq./sqft) |
Total GHG Emissions (tons CO2 eq.) |
|---|---|---|---|---|---|
|
Broadway Armory
🕰️
⚠️
C
5917 N Broadway Ave
| Other - Recreation | 1916 | 168,700 sqft | 6.2 kg/sqft | 967 tons |
|
California Park / McFetridge
🕰️
⚠️
D
3843 N California Ave
| Other - Recreation | 1970 | 157,284 sqft | 15.1 kg/sqft | 1,630 tons |
|
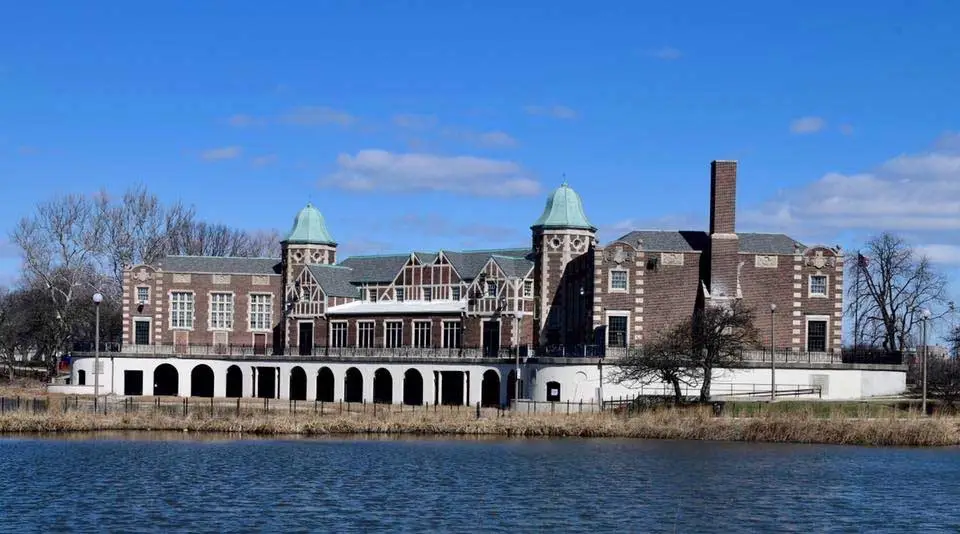
South Shore Cultural Center
📷
🕰️
⚠️
D
7059 South South Shore Drive
| Other - Recreation | 1916 | 136,014 sqft | 15.3 kg/sqft | 2,076 tons |
|
Chicago Indoor Sports
🕰️
⚠️
B
3900 S Ashland Ave
| Other - Recreation | 2007 | 91,000 sqft | 6.1 kg/sqft | 551 tons |
|
Fosco Park
🕰️
⚠️
D
1312 S Racine Ave
| Other - Recreation | 2005 | 89,780 sqft | 22.2 kg/sqft | 1,344 tons |
|
4635 W Leland Avenue AKA 4626 N Knox Avenue
B
4635 West Leland Avenue
| Other - Recreation | 1924 | 85,000 sqft
Lowest 32%
| 3.6 kg/sqft
Lowest 5%
| 303 tons
Lowest 8%
|
|
Loyola Park
🕰️
⚠️
F
1230 W Greenleaf Ave
| Other - Recreation | 1950 | 75,220 sqft | 21.2 kg/sqft | 1,190 tons |
|
Douglas Park
🕰️
⚠️
B
1401 S Sacramento Dr
| Other - Recreation | 1928 | 69,619 sqft | 5.3 kg/sqft | 304 tons |
|
Hamilton Park
🕰️
⚠️
F
513 W 72nd St
| Other - Recreation | 1905 | 66,458 sqft | 11.4 kg/sqft | 626 tons |
|
La Follette Park
🕰️
⚠️
C
1333 N Laramie Ave
| Other - Recreation | 1927 | 66,455 sqft | 4.9 kg/sqft | 318 tons |
|
Gage Park
🕰️
⚠️
D
2411 W 55th St
| Other - Recreation | 1926 | 64,960 sqft | 8.5 kg/sqft | 502 tons |
|
Calumet Park
🕰️
⚠️
A
9801 S Avenue G
| Other - Recreation | 1924 | 63,368 sqft | 4.7 kg/sqft | 271 tons |
|
Pulaski Park
🕰️
⚠️
D
1419 West Blackhawk
| Other - Recreation | 1914 | 60,246 sqft | 8.2 kg/sqft | 496 tons |
|
2367 W Logan
B
2367 West Logan Blvd
| Other - Recreation | 1997 | 58,004 sqft
Lowest 9%
| 4.0 kg/sqft
Lowest 9%
| 232 tons
Lowest 3%
|
|
Humboldt Park
📷
🕰️
⚠️
D
1440 North Sacramento
| Other - Recreation | 1928 | 57,229 sqft | 11.0 kg/sqft | 628 tons |
|
Mann Park
🕰️
⚠️
C
2949 E 131st St
| Other - Recreation | 1934 | 51,273 sqft | 6.7 kg/sqft | 344 tons |
|
Jarla, LLC
C
1825 W. Webster Ave.
| Other - Recreation | 2014 | 50,297 sqft
Lowest 1%
| 8.8 kg/sqft
Highest 18%
| 444 tons
Lowest 22%
|
Data Source:
Chicago Energy Benchmarking Data