

These buildings are the largest consumers of fossil gas (methane) in the city. Fossil gas in these buildings is typically used for heating gas and water, and since electrifying the grid won't clean up these emissions it's an important set of buildings to focus on!
Note: Data From Large Buildings in 2023
Note: This data only includes buildings whose emissions
are reported under the
Chicago Energy Benchmarking Ordinance. According to the City “As of 2016, this list includes all
commercial, institutional, and residential buildings larger than 50,000
square feet.”
The latest year of data is from 2023, but we update the site regularly when new data is available, and some buildings may have failed to report that year, and only have older data available.
Additionally, note that all tons specified are metric tons.
| Name / Address | Primary Property Type |
Fossil Gas Use (kBtu) |
GHG Intensity (kg CO2 eq./sqft) |
Total GHG Emissions (tons CO2 eq.) |
|---|---|---|---|---|
|
Cook County Department of Corrections Campus
🕰️
C
2700 S California Ave
| Prison/Incarceration | 376,640,218 kBtu | 9.3 kg/sqft | 42,560 tons |
|
METROPOLITIAN PIER AND EXPOSITION AUTHORITY
🚨
📷
C
301 East Cermak Road
| Convention Center | 350,084,782 kBtu #1 Highest
| 8.5 kg/sqft
Highest 20%
| 78,782 tons #2 Highest
|
|
Illinois Institute of Technology
🕰️
(Illinois Tech)
D
3300 South Federal Street
| College/University | 346,410,557 kBtu | 15.6 kg/sqft | 45,930 tons |
|
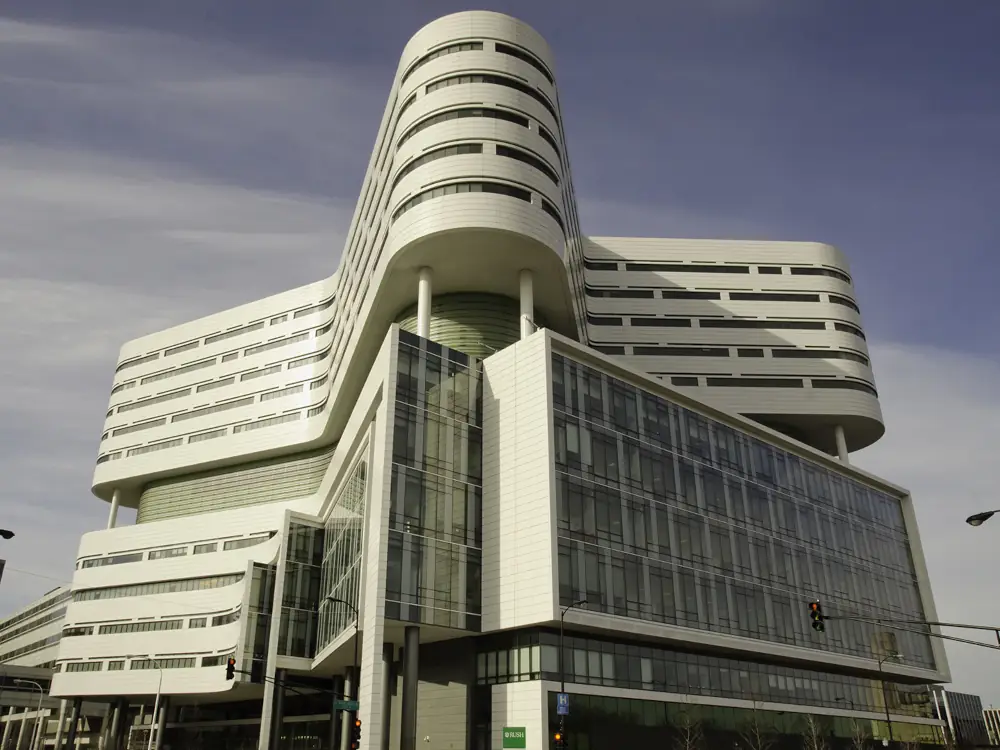
Rush University Medical Center
🚨
📷
D
1653 W Congress Pkwy
| Hospital (General Medical & Surgical) | 342,969,450 kBtu #2 Highest
| 23.0 kg/sqft #40 Highest
| 97,340 tons #1 Highest
|
|
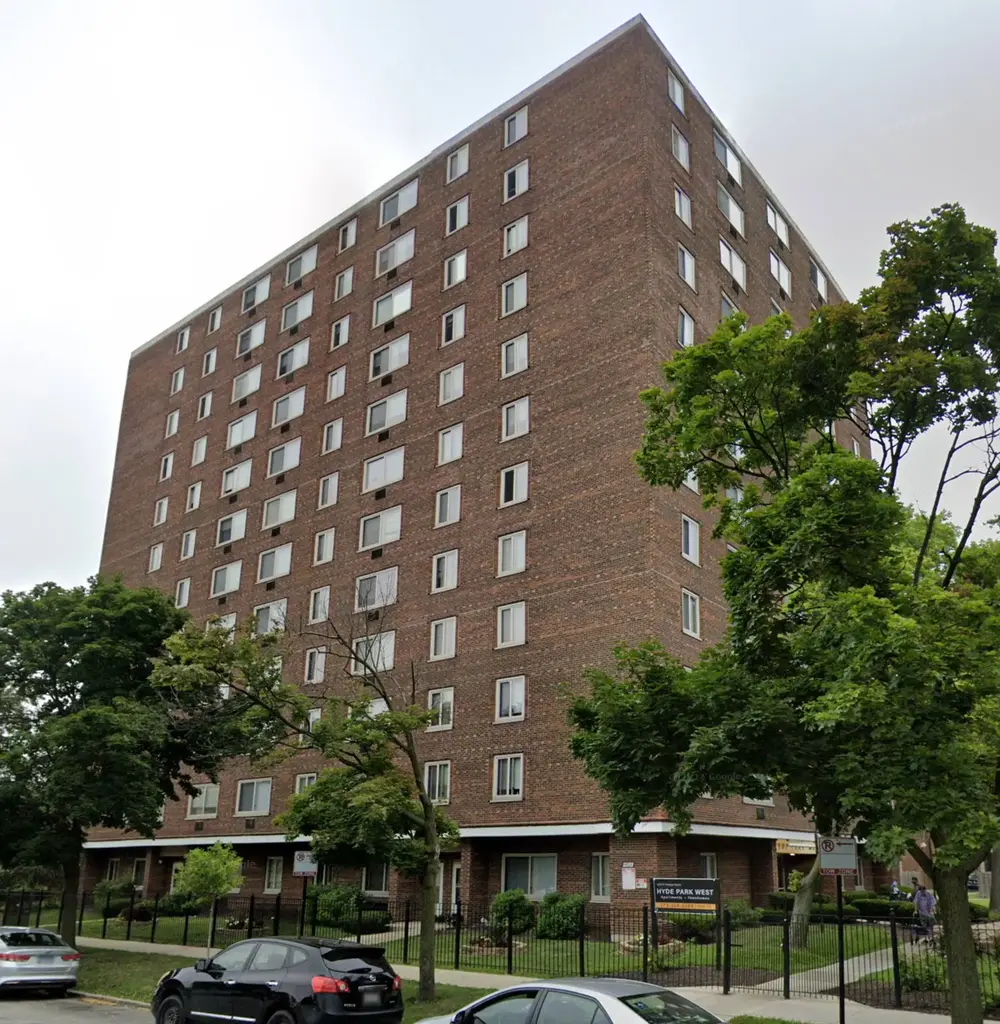
Hyde Park West Apartments
📷
🕰️
⚠️
F
5325 S. Cottage Grove Ave
| Multifamily Housing | 337,102,993 kBtu | 126.0 kg/sqft | 18,454 tons |
|
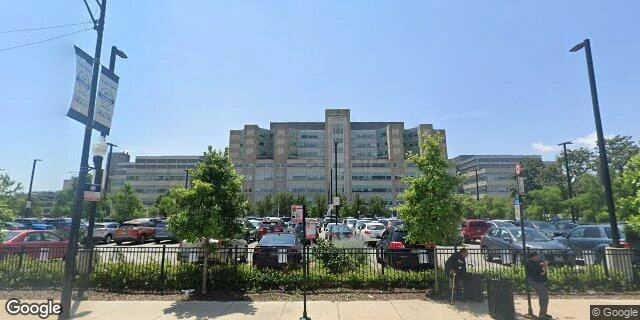
Stroger Hospital Campus
🚨
📷
D
1901 W. Harrison St.
| Hospital (General Medical & Surgical) | 325,493,521 kBtu #3 Highest
| 25.3 kg/sqft #27 Highest
| 40,317 tons #5 Highest
|
|
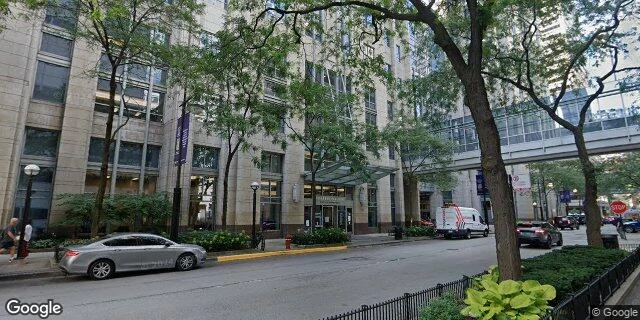
NMH Feinberg Pavilion and Galter Pavilion
📷
🕰️
⚠️
(Northwestern)
D
251 E Huron St
| Hospital (General Medical & Surgical) | 302,771,984 kBtu | 19.0 kg/sqft | 41,775 tons |
|
Ascension Resurrection Medical Center Campus.
🚨
D
7435 West Talcott Avenue
| Hospital (General Medical & Surgical) | 162,639,539 kBtu #4 Highest
| 18.9 kg/sqft
Highest 3%
| 20,709 tons #13 Highest
|
|
Ann & Robert H. Lurie Children's Hospital of Chicago
🚨
D
225 E Chicago Ave
| Hospital (General Medical & Surgical) | 157,733,355 kBtu #5 Highest
| 19.1 kg/sqft
Highest 3%
| 24,546 tons #7 Highest
|
|
Salem Baptist Church of Chicago
📷
🕰️
⚠️
D
10909 S Cottage Grove Ave
| Worship Facility | 130,570,525 kBtu | 78.0 kg/sqft | 7,160 tons |
|
The Art Institute of Chicago
🚨
📷
D
111 South Michigan Ave
| Museum | 130,248,120 kBtu #6 Highest
| 16.3 kg/sqft
Highest 4%
| 16,445 tons #22 Highest
|
|
Palmer House a Hilton Hotel (CHIPH)
🚨
📷
C
17 E. Monroe Street
| Hotel | 125,396,902 kBtu #7 Highest
| 8.4 kg/sqft
Highest 20%
| 14,166 tons #33 Highest
|
|
Advocate Illinois Masonic Medical Center
🚨
📷
D
836 W. Wellington Avenue
| Hospital (General Medical & Surgical) | 117,810,880 kBtu #8 Highest
| 12.0 kg/sqft
Highest 7%
| 15,246 tons #27 Highest
|
|
NMH Prentice Womens Hospital
🕰️
(Northwestern)
C
250 E Superior St
| Hospital (General Medical & Surgical) | 113,337,994 kBtu | 17.9 kg/sqft | 16,896 tons |
|
Hilton Chicago (CHICH)
🚨
📷
C
720 S. Michigan Avenue
| Hotel | 113,169,359 kBtu #9 Highest
| 8.1 kg/sqft
Highest 22%
| 16,604 tons #21 Highest
|
|
Ascension SMEMC St Mary Campus.
🚨
D
2233 West Division St
| Hospital (General Medical & Surgical) | 106,360,088 kBtu #10 Highest
| 21.8 kg/sqft
Highest 2%
| 15,204 tons #28 Highest
|
|
Presidential Towers (ps19;presto)
📷
⚠️
C
555 West Madison St
| Multifamily Housing | 106,073,383 kBtu #11 Highest
| 5.9 kg/sqft
Lowest 44%
| 12,510 tons #39 Highest
|
|
Hyatt Regency Chicago
🚩
📷
C
151 East Wacker Drive
| Hotel | 104,980,404 kBtu #12 Highest
| 7.5 kg/sqft
Highest 29%
| 15,113 tons #29 Highest
|
|
Holy Cross Hospital
⚠️
D
2701 W 68th St,
| Hospital (General Medical & Surgical) | 104,059,401 kBtu #13 Highest
| 21.9 kg/sqft
Highest 2%
| 8,989 tons
Highest 3%
|
|
The Field Museum
🚩
📷
D
1400 South Lake Shore Drive
| Mixed Use Property | 102,155,439 kBtu #14 Highest
| 11.3 kg/sqft
Highest 8%
| 14,449 tons #32 Highest
|
|
AbilityLab
🚩
D
355 E. Erie Ave
| Outpatient Rehabilitation/Physical Therapy | 97,785,890 kBtu #15 Highest
| 15.1 kg/sqft
Highest 5%
| 13,246 tons #36 Highest
|
|
IL0000FC-CHICAGO FEDERAL CTR
🚩
📷
B
219 S Dearborn
| Mixed Use Property | 97,712,716 kBtu #16 Highest
| 5.5 kg/sqft
Lowest 36%
| 17,419 tons #20 Highest
|
|
Altgeld Gardens
🚩
(CHA)
D
925 E. 130th Street
| Multifamily Housing | 96,830,597 kBtu #17 Highest
| 8.6 kg/sqft
Highest 19%
| 10,200 tons
Highest 2%
|
|
Northeastern Illinois University
🕰️
C
5500 N. Saint Louis Avenue
| College/University | 88,910,222 kBtu | 12.3 kg/sqft | 15,478 tons |
|
71215A State St
📷
🕰️
⚠️
C
101 N State St E
| Retail Store | 88,706,601 kBtu | 8.0 kg/sqft | 14,741 tons |
|
Mercy Chicago - Hospital
🕰️
⚠️
C
2525 S Michigan Ave
| Hospital (General Medical & Surgical) | 88,085,405 kBtu | 22.0 kg/sqft | 16,524 tons |
|
Ascension St Joseph Hospital - Chicago
🚩
D
2900 N Lake Shore Drive
| Hospital (General Medical & Surgical) | 86,709,672 kBtu #18 Highest
| 15.9 kg/sqft
Highest 4%
| 10,804 tons #48 Highest
|
|
Harris Bank Building
🕰️
C
115 S LaSalle St
| Office | 85,834,798 kBtu | 9.1 kg/sqft | 13,824 tons |
|
Regents Park
🚩
C
5020-5050 S Lake Shore Drive
| Multifamily Housing | 85,801,337 kBtu #19 Highest
| 5.9 kg/sqft
Lowest 44%
| 8,588 tons
Highest 3%
|
|
Navy Pier, Inc.
🚩
📷
C
600 E Grand Ave
| Mixed Use Property | 85,377,345 kBtu #20 Highest
| 13.3 kg/sqft
Highest 6%
| 15,325 tons #26 Highest
|
|
Parkway Gardens
🚩
C
6415 S. Calumet Ave
| Multifamily Housing | 85,159,155 kBtu #21 Highest
| 5.9 kg/sqft
Lowest 44%
| 5,498 tons
Highest 5%
|
|
WEISS MEMORIAL HOSPITAL
🕰️
⚠️
D
4646 N MARINE DR
| Hospital (General Medical & Surgical) | 83,216,042 kBtu | 27.7 kg/sqft | 11,410 tons |
|
MT SINAI HOSPITAL
⚠️
D
1501 S California Ave
| Hospital (General Medical & Surgical) | 82,301,704 kBtu #22 Highest
| 14.6 kg/sqft
Highest 5%
| 12,395 tons #40 Highest
|
|
Swedish Hospital Campus
🚩
C
5145 North California
| Mixed Use Property | 81,381,766 kBtu #23 Highest
| 20.5 kg/sqft
Highest 2%
| 16,427 tons #23 Highest
|
|
Shop & Save Market - Nagle
📷
🕰️
F
6312 N Nagle Ave
| Supermarket/Grocery Store | 80,514,978 kBtu | 83.7 kg/sqft | 5,584 tons |
|
Imperial Towers
🚩
C
4250 N Marine Dr.
| Multifamily Housing | 78,684,210 kBtu #24 Highest
| 4.8 kg/sqft
Lowest 22%
| 5,422 tons
Highest 5%
|
|
Lawless Gardens
🕰️
⚠️
C
3510 S RHODES AVE
| Multifamily Housing | 78,375,003 kBtu | 6.2 kg/sqft | 4,614 tons |
|
Trumbull Park Homes
🕰️
(CHA)
D
2437 E 106th St
| Multifamily Housing | 76,860,621 kBtu | 13.9 kg/sqft | 5,542 tons |
|
Jackson Park Hospital
🕰️
⚠️
D
7531 S Stony Island Ave
| Hospital (General Medical & Surgical) | 76,803,000 kBtu | 24.1 kg/sqft | 9,219 tons |
|
The Pavilion
⚠️
C
5441 N. East River Road
| Multifamily Housing | 74,958,051 kBtu #25 Highest
| 5.3 kg/sqft
Lowest 32%
| 5,690 tons
Highest 5%
|
|
Park Place Tower I Condominium (655 W Irving Park Rd )
🚩
C
655 W Irving Park Rd
| Multifamily Housing | 74,895,230 kBtu #26 Highest
| 6.9 kg/sqft
Highest 36%
| 6,857 tons
Highest 4%
|
|
theMART, Chicago
🚩
📷
A
222 Merchandise Mart Plaza
| Office | 73,046,757 kBtu #27 Highest
| 4.5 kg/sqft
Lowest 17%
| 18,631 tons #17 Highest
|
|
RICHARD J. DALEY CENTER
🚩
C
50 W. Washington
| Courthouse | 72,963,954 kBtu #28 Highest
| 6.8 kg/sqft
Highest 38%
| 10,558 tons #50 Highest
|
|
Arrive Streeterville
🚩
D
333 E Ontario Street
| Multifamily Housing | 72,377,793 kBtu #29 Highest
| 9.5 kg/sqft
Highest 14%
| 8,160 tons
Highest 3%
|
|
4700 N MARINE DR
🕰️
⚠️
F
4700 N MARINE DR
| Medical Office | 71,164,912 kBtu | 31.1 kg/sqft | 4,594 tons |
|
135 S LaSalle Property LLC
🚩
📷
A
135 S. Lasalle Street
| Office | 70,041,485 kBtu #30 Highest
| 4.0 kg/sqft
Lowest 9%
| 9,880 tons
Highest 2%
|
|
The Clare
🕰️
⚠️
D
55 E Pearson St
| Multifamily Housing | 69,000,499 kBtu | 12.1 kg/sqft | 7,570 tons |
|
Aon Center
🚩
📷
B
200 E. Randolph Street
| Office | 68,682,641 kBtu #31 Highest
| 5.9 kg/sqft
Lowest 44%
| 18,914 tons #16 Highest
|
|
Provident Hospital
🚩
D
500 E. 51st St.
| Hospital (General Medical & Surgical) | 68,044,069 kBtu #32 Highest
| 23.8 kg/sqft #36 Highest
| 8,893 tons
Highest 3%
|
|
Kennedy-King College
🚩
(City Colleges)
D
6301 South Halsted
| College/University | 67,744,546 kBtu #33 Highest
| 15.3 kg/sqft
Highest 4%
| 7,613 tons
Highest 3%
|
Data Source:
Chicago Energy Benchmarking Data