Electrify Chicago
An independent tool for viewing City of Chicago building data
According to the
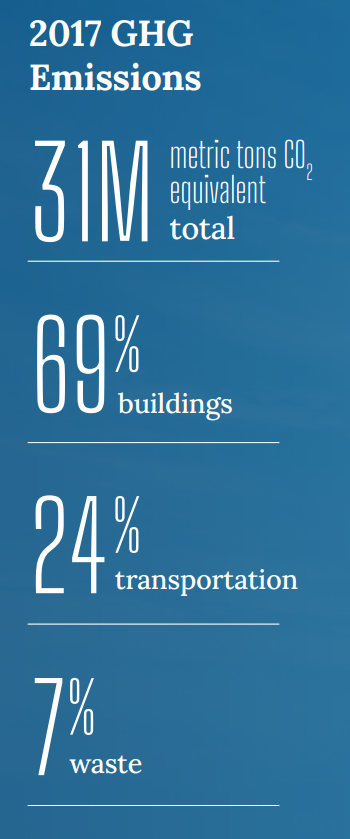
2022 Chicago Climate Action Plan, 69% of Chicago's emissions come from buildings,
making building emissions our biggest challenge and
our biggest opportunity as a city to tackle climate change.
At Electrify Chicago, we showcase building performance using
publicly available data supplemented by community-submitted
photographs and building owners.
Start by looking at Chicago's buildings with the highest greenhouse gas intensity i.e. emissions per square foot. Large, efficient, buildings can perform much better than very inefficient small buildings on this metric.
New Article
📰 $30 Million In Missed Fines
The City Of Chicago failed to collect $30 million in potential fines from the building benchmarking ordinance, reducing transparency and accountability.
Chicago Buildings by Greenhouse Gas Intensity
Note: Data From Large Buildings in 2022
Note: This data only includes buildings whose emissions
are reported under the
Chicago Energy Benchmarking Ordinance. According to the City “As of 2016, this list includes all
commercial, institutional, and residential buildings larger than 50,000
square feet.”
The latest year of data is from 2022, but we update the site regularly when new data is available, and some buildings may have failed to report that year, and only have older data available.
Additionally, note that all tons specified are metric tons.
| Name / Address | Primary Property Type |
GHG Intensity (kg CO2 eq./sqft) |
Total GHG Emissions (tons CO2 eq.) |
|---|---|---|---|
|
Ratner Athletics Center
(UChicago)
5530 S Ellis Ave
| Fitness Center/Health Club/Gym | 18.9 kg/sqft
Highest 3%
| 3,186 tons
Highest 12%
|
|
Jewel Osco, 03296-Foster & Harlem
7342 W Foster Ave
| Supermarket/Grocery Store | 18.9 kg/sqft
Highest 3%
| 1,457 tons
Highest 32%
|
|
The Art Institute of Chicago
🚨
📷
111 S Michigan Ave
| Museum | 18.9 kg/sqft
Highest 3%
| 19,069 tons #17 Highest
|
|
Chicago Historical Society
🕰️
1601 N Clark Street
| Museum | 18.8 kg/sqft | 5,074 tons |
|
Sheridan Shores Nursing Rehabilitation
🕰️
5838 N. Sheridan Rd.
| Senior Care Community | 18.8 kg/sqft | 943 tons |
|
Costco
2746 N Clybourn Ave
| Supermarket/Grocery Store | 18.8 kg/sqft
Highest 3%
| 2,682 tons
Highest 16%
|
|
Riverfront Plaza
🕰️
2647 N Elston Avenue
| Strip Mall | 18.7 kg/sqft | 3,980 tons |
|
Harpo Studios
🕰️
110 N Carpenter
| Other - Entertainment/Public Assembly | 18.7 kg/sqft | 2,480 tons |
|
Integrys Group Division Street Facility
🕰️
1241 West Division Street
| Repair Services (Vehicle, Shoe, Locksmith, etc.) | 18.7 kg/sqft | 2,710 tons |
|
Jewel Osco, 03170-Pulaski & 55th St
5320 S Pulaski Rd
| Supermarket/Grocery Store | 18.7 kg/sqft
Highest 3%
| 1,348 tons
Highest 35%
|
|
Presence Resurrection Medical Center
🚨
7435 W Talcott Ave
| Hospital (General Medical & Surgical) | 18.7 kg/sqft
Highest 3%
| 20,493 tons #12 Highest
|
|
Mansueto Library
(UChicago)
1100 E 57th St
| Library | 18.6 kg/sqft
Highest 3%
| 1,189 tons
Highest 39%
|
|
Ann & Robert H. Lurie Children's Hospital of Chicago
🚨
225 E Chicago Ave
| Hospital (General Medical & Surgical) | 18.6 kg/sqft
Highest 3%
| 24,012 tons #9 Highest
|
|
Shriners Hospital for Children-Chicago
2211 N Oak Park Ave
| Hospital (General Medical & Surgical) | 18.6 kg/sqft
Highest 3%
| 3,652 tons
Highest 10%
|
|
United Center
🕰️
1901 W Madison St
| Indoor Arena | 18.6 kg/sqft | 17,884 tons |
Data Source:
Chicago Energy Benchmarking Data
