Electrify Chicago
An independent tool for viewing City of Chicago building data
According to the
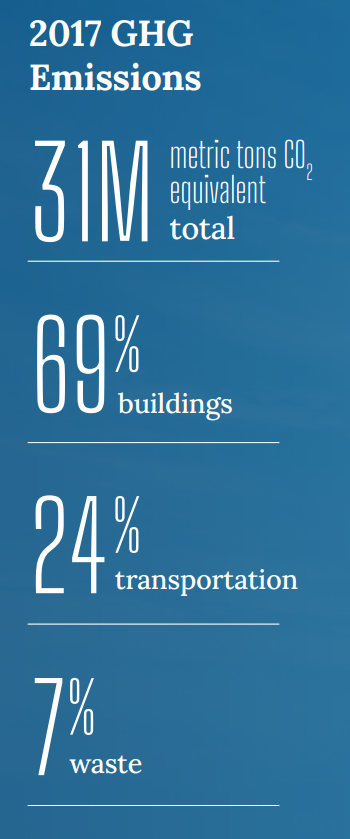
2022 Chicago Climate Action Plan, 69% of Chicago's emissions come from buildings,
making building emissions our biggest challenge and
our biggest opportunity as a city to tackle climate change.
At Electrify Chicago, we showcase building performance using
publicly available data supplemented by community-submitted
photographs and building owners.
Start by looking at Chicago's buildings with the highest greenhouse gas intensity i.e. emissions per square foot. Large, efficient, buildings can perform much better than very inefficient small buildings on this metric.
New Article
📰 $30 Million In Missed Fines
The City Of Chicago failed to collect $30 million in potential fines from the building benchmarking ordinance, reducing transparency and accountability.
Chicago Buildings by Greenhouse Gas Intensity
Note: Data From Large Buildings in 2022
Note: This data only includes buildings whose emissions
are reported under the
Chicago Energy Benchmarking Ordinance. According to the City “As of 2016, this list includes all
commercial, institutional, and residential buildings larger than 50,000
square feet.” This dataset is also then filtered to only buildings
with reported emissions > 1,000 metric tons CO2 equivalent.
The latest year of data is from 2022, but we update the site regularly when new data is available, and some buildings may have failed to report that year, and only have older data available.
Additionally, note that all tons specified are metric tons.
| Name / Address | Primary Property Type |
GHG Intensity (kg CO2 eq./sqft) |
Total GHG Emissions (tons CO2 eq.) |
|---|---|---|---|
|
Nash Elementary, Henry H -CPS
🕰️
(CPS)
4837 W Erie St
| K-12 School | 6.8 kg/sqft | 744 tons |
|
Palmer Elementary, John M -CPS
(CPS)
5501 N Kenneth Ave
| K-12 School | 6.8 kg/sqft
Highest 43%
| 803 tons
Lowest 46%
|
|
Burke Elementary -CPS
🕰️
(CPS)
5356 S King Dr
| K-12 School | 6.8 kg/sqft | 499 tons |
|
Washington Elementary, Harold -CPS
🕰️
(CPS)
9130 S University Ave
| K-12 School | 6.8 kg/sqft | 523 tons |
|
Reavis Specialty Elementary -CPS
🕰️
(CPS)
834 E 50th St
| K-12 School | 6.8 kg/sqft | 392 tons |
|
Crown Community Academy -CPS
🕰️
(CPS)
2128 S St Louis Ave
| K-12 School | 6.8 kg/sqft | 430 tons |
|
Lincoln Park Villas
1920 N Clark St
| Multifamily Housing | 6.8 kg/sqft
Highest 43%
| 491 tons
Lowest 26%
|
|
1242 N Lake Shore Dr
1242 N Lake Shore Dr
| Multifamily Housing | 6.8 kg/sqft
Highest 43%
| 934 tons
Highest 47%
|
|
Harbor House Condominium Association
3200 N Lake Shore Dr
| Multifamily Housing | 6.8 kg/sqft
Highest 43%
| 2,909 tons
Highest 15%
|
|
Margaret Day Blake Apartments
(CHA)
2140 N Clark St
| Multifamily Housing | 6.8 kg/sqft
Highest 43%
| 480 tons
Lowest 24%
|
|
Lancaster Condo Association
201 N Westshore Dr
| Multifamily Housing | 6.8 kg/sqft
Highest 43%
| 2,207 tons
Highest 20%
|
|
2650 Lakeview Condominium Association
2650 N Lakeview Ave
| Multifamily Housing | 6.8 kg/sqft
Highest 43%
| 3,216 tons
Highest 12%
|
|
The Edge Lofts & Tower Condominium Association
210 S Des Plaines St
| Multifamily Housing | 6.8 kg/sqft
Highest 43%
| 1,624 tons
Highest 29%
|
|
336 Wellington Association
336 W WELLINGTON AVE
| Multifamily Housing | 6.8 kg/sqft
Highest 43%
| 922 tons
Highest 48%
|
|
Prairie District Homes Tower Residences Condominiu
1717 S Prairie Ave
| Multifamily Housing | 6.8 kg/sqft
Highest 43%
| 1,971 tons
Highest 23%
|
Data Source:
Chicago Energy Benchmarking Data
