Electrify Chicago
An independent tool for viewing City of Chicago building data
According to the
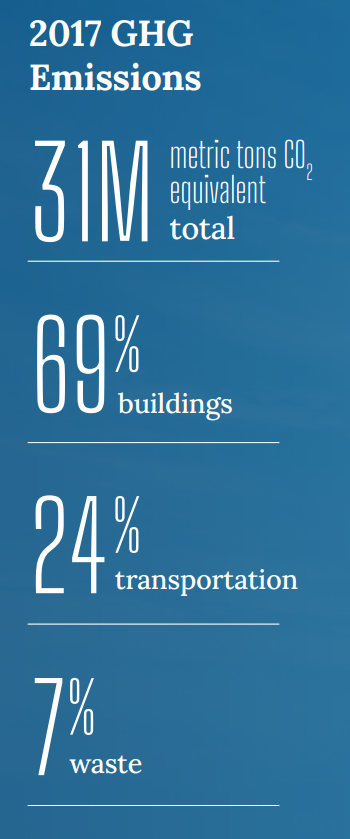
2022 Chicago Climate Action Plan,
69% of Chicago's emissions come from buildings, making
building emissions our biggest challenge and our biggest opportunity as a city
to tackle climate change. At Electrify Chicago, we showcase building performance using
publicly available data supplemented by community-submitted photographs and building
owners.
Start by looking at Chicago's buildings with the highest greenhouse gas intensity i.e. emissions per square foot. Large, efficient, buildings can perform much better than very inefficient small buildings on this metric.
New Article
📰 $30 Million In Missed Fines
The City Of Chicago failed to collect $30 million in potential fines from the building benchmarking ordinance, reducing transparency and accountability.
Chicago Buildings by Greenhouse Gas Intensity
Note: Data From Large Buildings in 2022
Note: This data only includes buildings whose emissions are reported
under the
Chicago Energy Benchmarking Ordinance. According to the City “As of 2016,
this list includes all commercial, institutional, and residential buildings larger than
50,000 square feet.” This dataset is also then filtered to only buildings with
reported emissions > 1,000 metric tons CO2 equivalent.
The latest year of data is from 2022, but we update the site regularly when new data is available, and some buildings may have failed to report that year, and only have older data available.
Additionally, note that all tons specified are metric tons.
| Name / Address | Primary Property Type |
GHG Intensity (kg CO2 eq./sqft) |
Total GHG Emissions (tons CO2 eq.) |
|---|---|---|---|
|
Mark Sheridan Math & Science Academy
🕰️
(CPS)
533 W 27th St
| K-12 School | 5.2 kg/sqft | 405 tons |
|
Burley Elementary, Augustus H -CPS
(CPS)
1630 W Barry Ave
| K-12 School | 5.2 kg/sqft
Lowest 28%
| 306 tons
Lowest 9%
|
|
333 N Jefferson
333 N Jefferson St
| Multifamily Housing | 5.2 kg/sqft
Lowest 28%
| 330 tons
Lowest 11%
|
|
444 N Wells St
444 N Wells St
| Office | 5.2 kg/sqft
Lowest 28%
| 384 tons
Lowest 15%
|
|
325 W Huron St
325 W Huron St
| Office | 5.2 kg/sqft
Lowest 28%
| 782 tons
Lowest 45%
|
|
Hektoen Building
🕰️
627 S Wood St
| Laboratory | 5.2 kg/sqft | 962 tons |
|
400 North LaSalle Condominium Association
400 N LaSalle St
| Multifamily Housing | 5.2 kg/sqft
Lowest 28%
| 3,119 tons
Highest 13%
|
|
Winston Towers One
6933 N Kedzie Ave
| Multifamily Housing | 5.2 kg/sqft
Lowest 28%
| 1,689 tons
Highest 28%
|
|
City Centre Condominium
🕰️
208 W. Washington Street
| Multifamily Housing | 5.2 kg/sqft | 2,015 tons |
|
5514 South Cornell Condominium Association
5514 5524 S CORNELL AVE
| Multifamily Housing | 5.2 kg/sqft
Lowest 28%
| 283 tons
Lowest 7%
|
|
Chicago Teachers Union
1901 1945 CARROLL AVE
| Office | 5.2 kg/sqft
Lowest 28%
| 578 tons
Lowest 32%
|
|
The Flamingo
🕰️
5500 S SHORE DR
| Multifamily Housing | 5.2 kg/sqft | 851 tons |
|
The Denifer
🕰️
5400 5406 N KENMORE AVE
| Multifamily Housing | 5.2 kg/sqft | 426 tons |
|
St. Mary of Providence
4200 N Austin Ave
| Mixed Use Property | 5.2 kg/sqft
Lowest 28%
| 1,009 tons
Highest 45%
|
|
515 517 N NOBLE ST
515 517 N NOBLE ST
| Multifamily Housing | 5.2 kg/sqft
Lowest 28%
| 340 tons
Lowest 11%
|
Data Source:
Chicago Energy Benchmarking Data
