Electrify Chicago
An independent tool for viewing City of Chicago building data
According to the
2022 Chicago Climate Action Plan,
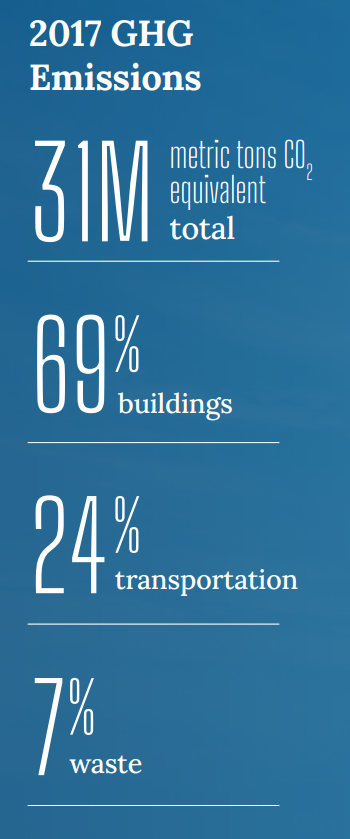
69% of Chicago's emissions come from buildings, making
building emissions our biggest challenge and our biggest opportunity as a city
to tackle climate change. At Electrify Chicago, we showcase building performance using
publicly available data supplemented by community-submitted photographs and building
owners.
Start by looking at Chicago's buildings with the highest greenhouse gas intensity i.e. emissions per square foot. Large, efficient, buildings can perform much better than very inefficient small buildings on this metric.
New Article
📰 $30 Million In Missed Fines
The City Of Chicago failed to collect $30 million in potential fines from the building benchmarking ordinance, reducing transparency and accountability.
Chicago Buildings by Greenhouse Gas Intensity
Note: Data From Large Buildings in 2022
Note: This data only includes buildings whose emissions are reported
under the
Chicago Energy Benchmarking Ordinance. According to the City “As of 2016,
this list includes all commercial, institutional, and residential buildings larger than
50,000 square feet.” This dataset is also then filtered to only buildings with
reported emissions > 1,000 metric tons CO2 equivalent.
The latest year of data is from 2022, but we update the site regularly when new data is available, and some buildings may have failed to report that year, and only have older data available.
Additionally, note that all tons specified are metric tons.
| Name / Address | Primary Property Type |
GHG Intensity (kg CO2 eq./sqft) |
Total GHG Emissions (tons CO2 eq.) |
|---|---|---|---|
|
North Shore Baptist Church
🕰️
5244 N Lakewood Ave
| Worship Facility | 3.2 kg/sqft | 162 tons |
|
Cosmopolitan Lofts Condominium Association
1133 1137 S WABASH AVE
| Multifamily Housing | 3.2 kg/sqft
Lowest 4%
| 323 tons
Lowest 10%
|
|
Smith Park Commons Condominium Association
🕰️
2455 W. Ohio St.
| Multifamily Housing | 3.2 kg/sqft | 311 tons |
|
Emmanuel Baptist Church
🕰️
8301 S Damen Ave
| Worship Facility | 3.2 kg/sqft | 240 tons |
|
6200 6248 N CLARK ST
🏆
6200 6248 N CLARK ST
| Multifamily Housing | 3.2 kg/sqft
Lowest 4%
| 639 tons
Lowest 36%
|
|
EuroFurniture
🕰️
2145 W Grand Ave
| Retail Store | 3.2 kg/sqft | 220 tons |
|
1300 Dearborn
🕰️
1300 1310 N DEARBORN ST
| Retail Store | 3.2 kg/sqft | 191 tons |
|
1733 1735 W IRVING PARK RD
1733 1735 W IRVING PARK RD
| Multifamily Housing | 3.2 kg/sqft
Lowest 4%
| 295 tons
Lowest 8%
|
|
2444 2458 N LAKEVIEW AVE
2444 2458 N LAKEVIEW AVE
| Multifamily Housing | 3.2 kg/sqft
Lowest 4%
| 310 tons
Lowest 9%
|
|
190 E WALTON PL
190 E WALTON PL
| Multifamily Housing | 3.2 kg/sqft
Lowest 4%
| 305 tons
Lowest 9%
|
|
4401-09 N. Malden St.
🕰️
4401-09 N. Malden St.
| Multifamily Housing | 3.2 kg/sqft | 160 tons |
|
Blue Moon Lofts
215 N. Aberdeen St.
| Multifamily Housing | 3.1 kg/sqft
Lowest 4%
| 261 tons
Lowest 5%
|
|
Moser Building Condominium Association
621 S Plymouth Ct
| Multifamily Housing | 3.1 kg/sqft
Lowest 4%
| 442 tons
Lowest 20%
|
|
1812-1840 Hubbard St
1812 - 1840 W Hubbard St
| Mixed Use Property | 3.1 kg/sqft
Lowest 4%
| 374 tons
Lowest 14%
|
|
Wadsworth-CPS
🕰️
(CPS)
6420 S UNIVERSITY AVE
| K-12 School | 3.1 kg/sqft | 392 tons |
Data Source:
Chicago Energy Benchmarking Data
