Electrify Chicago
An independent tool for viewing City of Chicago building data
According to the
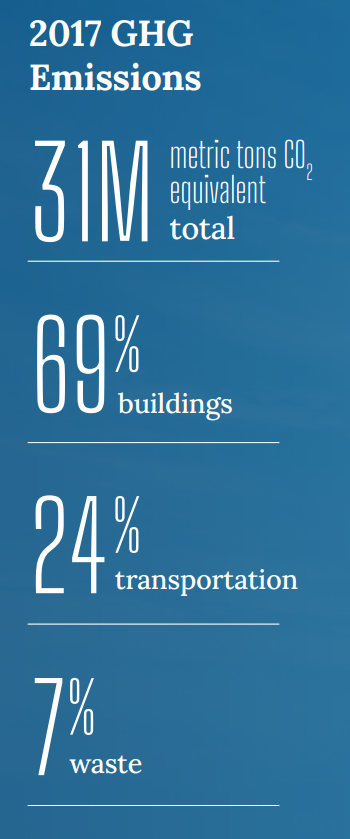
2022 Chicago Climate Action Plan, 69% of Chicago's emissions come from buildings,
making building emissions our biggest challenge and
our biggest opportunity as a city to tackle climate change.
At Electrify Chicago, we showcase building performance using
publicly available data supplemented by community-submitted
photographs and building owners.
Start by looking at Chicago's buildings with the highest greenhouse gas intensity i.e. emissions per square foot. Large, efficient, buildings can perform much better than very inefficient small buildings on this metric.
New Article
📰 $30 Million In Missed Fines
The City Of Chicago failed to collect $30 million in potential fines from the building benchmarking ordinance, reducing transparency and accountability.
Chicago Buildings by Greenhouse Gas Intensity
Note: Data From Large Buildings in 2022
Note: This data only includes buildings whose emissions
are reported under the
Chicago Energy Benchmarking Ordinance. According to the City “As of 2016, this list includes all
commercial, institutional, and residential buildings larger than 50,000
square feet.”
The latest year of data is from 2022, but we update the site regularly when new data is available, and some buildings may have failed to report that year, and only have older data available.
Additionally, note that all tons specified are metric tons.
| Name / Address | Primary Property Type |
GHG Intensity (kg CO2 eq./sqft) |
Total GHG Emissions (tons CO2 eq.) |
|---|---|---|---|
|
340 E Superior Street
(Northwestern)
340 E Superior Street
| College/University | 12.6 kg/sqft
Highest 7%
| 2,366 tons
Highest 19%
|
|
Ray and Joan Kroc Corps Community Center
1250 W 119th St
| Fitness Center/Health Club/Gym | 12.6 kg/sqft
Highest 7%
| 1,999 tons
Highest 23%
|
|
Marriott Chicago at Medical District/UIC
625 S Ashland Ave
| Hotel | 12.6 kg/sqft
Highest 7%
| 904 tons
Highest 49%
|
|
Hostelling International Chicago, The J. Ira and Nicki Harris Family Hostel
24 E Congress Pkwy
| Hotel | 12.6 kg/sqft
Highest 7%
| 1,271 tons
Highest 37%
|
|
Illinois Center Lakeshore Athletic Club
211 N STETSON AVE
| Fitness Center/Health Club/Gym | 12.6 kg/sqft
Highest 7%
| 1,492 tons
Highest 31%
|
|
Aperion Care International
4815 S Western Blvd
| Senior Living Community | 12.5 kg/sqft
Highest 8%
| 1,140 tons
Highest 41%
|
|
Gateway Centre
1701 - 1741 W Howard St
| Strip Mall | 12.5 kg/sqft
Highest 8%
| 835 tons
Lowest 48%
|
|
19 South LaSalle Building
🕰️
19 South LaSalle
| Office | 12.5 kg/sqft | 2,018 tons |
|
Chicago-Central
🕰️
4058 W Melrose St
| Other - Specialty Hospital | 12.5 kg/sqft | 1,489 tons |
|
4346 N HONORE ST
4346 N HONORE ST
| Multifamily Housing | 12.4 kg/sqft
Highest 8%
| 507 tons
Lowest 27%
|
|
Hope College Preparatory High School
🕰️
(CPS)
5515 South Lowe Ave
| K-12 School | 12.4 kg/sqft | 1,984 tons |
|
Hampton Inn Chicago Downtown/N Loop/Michigan Ave
🕰️
68 East Wacker Place
| Hotel | 12.4 kg/sqft | 1,062 tons |
|
Riverpoint Owner, LLC
1730 W Fullerton Ave
| Strip Mall | 12.4 kg/sqft
Highest 8%
| 2,619 tons
Highest 17%
|
|
909 W WASHINGTON BLVD
909 W WASHINGTON BLVD
| Multifamily Housing | 12.4 kg/sqft
Highest 8%
| 1,136 tons
Highest 41%
|
|
7914 7932 S WABASH AVE
🕰️
7914 7932 S WABASH AVE
| Multifamily Housing | 12.4 kg/sqft | 375 tons |
Data Source:
Chicago Energy Benchmarking Data
