Electrify Chicago
An independent tool for viewing City of Chicago building data
According to the
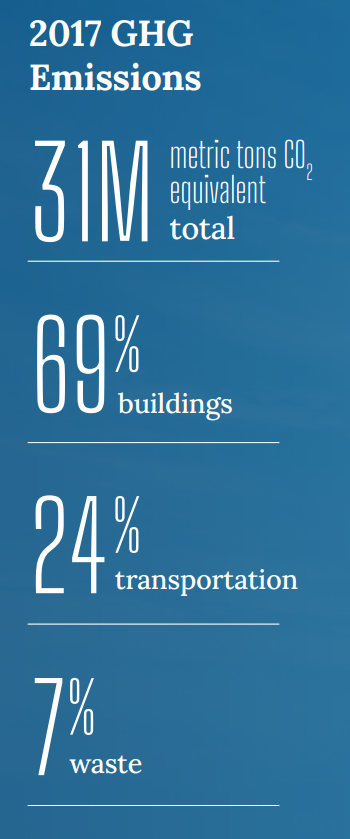
2022 Chicago Climate Action Plan, 69% of Chicago's emissions come from buildings,
making building emissions our biggest challenge and
our biggest opportunity as a city to tackle climate change.
At Electrify Chicago, we showcase building performance using
publicly available data supplemented by community-submitted
photographs and building owners.
Start by looking at Chicago's buildings with the highest greenhouse gas intensity i.e. emissions per square foot. Large, efficient, buildings can perform much better than very inefficient small buildings on this metric.
New Article
📰 $30 Million In Missed Fines
The City Of Chicago failed to collect $30 million in potential fines from the building benchmarking ordinance, reducing transparency and accountability.
Chicago Buildings by Greenhouse Gas Intensity
Note: Data From Large Buildings in 2022
Note: This data only includes buildings whose emissions
are reported under the
Chicago Energy Benchmarking Ordinance. According to the City “As of 2016, this list includes all
commercial, institutional, and residential buildings larger than 50,000
square feet.”
The latest year of data is from 2022, but we update the site regularly when new data is available, and some buildings may have failed to report that year, and only have older data available.
Additionally, note that all tons specified are metric tons.
| Name / Address | Primary Property Type |
GHG Intensity (kg CO2 eq./sqft) |
Total GHG Emissions (tons CO2 eq.) |
|---|---|---|---|
|
1521 S WABASH AVE
1521 S WABASH AVE
| Multifamily Housing | 12.0 kg/sqft
Highest 8%
| 747 tons
Lowest 43%
|
|
Hilton Chicago MM Suites
198 E Delaware Pl
| Hotel | 12.0 kg/sqft
Highest 8%
| 3,778 tons
Highest 10%
|
|
The Oliver on LaSalle
1140 N La Salle Dr
| Multifamily Housing | 11.9 kg/sqft
Highest 8%
| 373 tons
Lowest 14%
|
|
360 N STATE ST
360 N STATE ST
| Other | 11.9 kg/sqft
Highest 8%
| 906 tons
Highest 49%
|
|
Broadway at Surf
🕰️
2828-2868 N. Broadway
| Other - Mall | 11.9 kg/sqft | 1,632 tons |
|
Damen/Hastings
1340 S Damen Ave
| Office | 11.9 kg/sqft
Highest 8%
| 1,910 tons
Highest 24%
|
|
Shorewind Towers
🕰️
7000 7008 S SOUTH SHORE DR
| Multifamily Housing | 11.9 kg/sqft | 2,444 tons |
|
311 W. Superior
🕰️
311 W Superior St
| Office | 11.8 kg/sqft | 1,081 tons |
|
UNO Soccer Academy
5050 S HOMAN AVE
| K-12 School | 11.8 kg/sqft
Highest 9%
| 745 tons
Lowest 43%
|
|
Chalmers-CPS
🕰️
(CPS)
2745 W Roosevelt Rd
| K-12 School | 11.8 kg/sqft | 805 tons |
|
Point at Clark
3131 N Clark St
| Strip Mall | 11.8 kg/sqft
Highest 9%
| 1,069 tons
Highest 43%
|
|
4900 N Bernard
4900 N Bernard
| Senior Living Community | 11.7 kg/sqft
Highest 9%
| 670 tons
Lowest 38%
|
|
Incubator Building
🕰️
(Illinois Tech)
55 W 34th Street
| College/University | 11.7 kg/sqft | 846 tons |
|
2710 N. Clark St
2710 N. Clark St
| Senior Living Community | 11.7 kg/sqft
Highest 9%
| 585 tons
Lowest 32%
|
|
Ambulatory Care Center, St. Bernard Hospital
6307 S STEWART AVE
| Medical Office | 11.7 kg/sqft
Highest 9%
| 778 tons
Lowest 44%
|
Data Source:
Chicago Energy Benchmarking Data
