Electrify Chicago
An independent tool for viewing City of Chicago building data
According to the
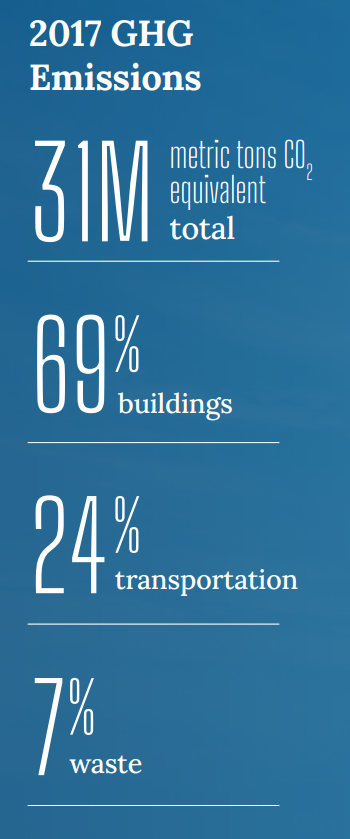
2022 Chicago Climate Action Plan, 69% of Chicago's emissions come from buildings,
making building emissions our biggest challenge and
our biggest opportunity as a city to tackle climate change.
At Electrify Chicago, we showcase building performance using
publicly available data supplemented by community-submitted
photographs and building owners.
Start by looking at Chicago's buildings with the highest greenhouse gas intensity i.e. emissions per square foot. Large, efficient, buildings can perform much better than very inefficient small buildings on this metric.
New Article
📰 $30 Million In Missed Fines
The City Of Chicago failed to collect $30 million in potential fines from the building benchmarking ordinance, reducing transparency and accountability.
Chicago Buildings by Greenhouse Gas Intensity
Note: Data From Large Buildings in 2022
Note: This data only includes buildings whose emissions
are reported under the
Chicago Energy Benchmarking Ordinance. According to the City “As of 2016, this list includes all
commercial, institutional, and residential buildings larger than 50,000
square feet.”
The latest year of data is from 2022, but we update the site regularly when new data is available, and some buildings may have failed to report that year, and only have older data available.
Additionally, note that all tons specified are metric tons.
| Name / Address | Primary Property Type |
GHG Intensity (kg CO2 eq./sqft) |
Total GHG Emissions (tons CO2 eq.) |
|---|---|---|---|
|
Axis Apartments & Lofts
441 E Erie St
| Multifamily Housing | 11.3 kg/sqft
Highest 10%
| 6,474 tons
Highest 5%
|
|
1111 N Clark St
1111 N Clark St
| Vehicle Dealership | 11.3 kg/sqft
Highest 10%
| 1,017 tons
Highest 44%
|
|
Claretian Missionaries Service
🕰️
205 W. Monroe
| Worship Facility | 11.3 kg/sqft | 1,223 tons |
|
Quality Inn Midway Airport
🕰️
7353 S CICERO AVE
| Hotel | 11.3 kg/sqft | 983 tons |
|
Lake Meadows Shopping Center Building 2
3445 3481 S King Dr
| Fitness Center/Health Club/Gym | 11.2 kg/sqft
Highest 10%
| 675 tons
Lowest 39%
|
|
Gateway Chicago West
3828 W Taylor St
| Residential Care Facility | 11.2 kg/sqft
Highest 10%
| 575 tons
Lowest 32%
|
|
BAI Century, LLC
2828 N Clark St
| Enclosed Mall | 11.2 kg/sqft
Highest 10%
| 1,954 tons
Highest 24%
|
|
840 N Michigan Ave
840 N Michigan Ave
| Retail Store | 11.2 kg/sqft
Highest 10%
| 973 tons
Highest 46%
|
|
Gunsaulus Hall
🕰️
(Illinois Tech)
3140 S Michigan Avenue
| Residence Hall/Dormitory | 11.1 kg/sqft | 924 tons |
|
908 920 W ARGYLE ST
908 920 W ARGYLE ST
| Senior Living Community | 11.1 kg/sqft
Highest 10%
| 1,637 tons
Highest 29%
|
|
City North 14
2600 N Western Ave
| Movie Theater | 11.1 kg/sqft
Highest 10%
| 809 tons
Lowest 47%
|
|
30 W OAK ST
30 W OAK ST
| Multifamily Housing | 11.1 kg/sqft
Highest 10%
| 1,985 tons
Highest 23%
|
|
Charles M. Harper Cetner (Booth School)
(UChicago)
5807 S Woodlawn Ave
| College/University | 11.1 kg/sqft
Highest 10%
| 4,640 tons
Highest 7%
|
|
CW GLL 444 N Michigan
444 N Michigan Ave
| Office | 11.1 kg/sqft
Highest 10%
| 5,746 tons
Highest 6%
|
|
300 E Randolph
🕰️
300 E Randolph
| Office | 11.1 kg/sqft | 24,655 tons |
Data Source:
Chicago Energy Benchmarking Data
