Electrify Chicago
An independent tool for viewing City of Chicago building data
According to the
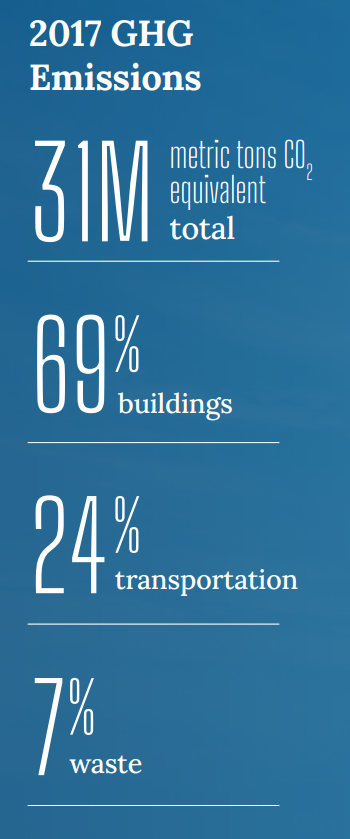
2022 Chicago Climate Action Plan, 69% of Chicago's emissions come from buildings,
making building emissions our biggest challenge and
our biggest opportunity as a city to tackle climate change.
At Electrify Chicago, we showcase building performance using
publicly available data supplemented by community-submitted
photographs and building owners.
Start by looking at Chicago's buildings with the highest greenhouse gas intensity i.e. emissions per square foot. Large, efficient, buildings can perform much better than very inefficient small buildings on this metric.
New Article
📰 $30 Million In Missed Fines
The City Of Chicago failed to collect $30 million in potential fines from the building benchmarking ordinance, reducing transparency and accountability.
Chicago Buildings by Greenhouse Gas Intensity
Note: Data From Large Buildings in 2022
Note: This data only includes buildings whose emissions
are reported under the
Chicago Energy Benchmarking Ordinance. According to the City “As of 2016, this list includes all
commercial, institutional, and residential buildings larger than 50,000
square feet.”
The latest year of data is from 2022, but we update the site regularly when new data is available, and some buildings may have failed to report that year, and only have older data available.
Additionally, note that all tons specified are metric tons.
| Name / Address | Primary Property Type |
GHG Intensity (kg CO2 eq./sqft) |
Total GHG Emissions (tons CO2 eq.) |
|---|---|---|---|
|
Haines Elementary -CPS
(CPS)
247 W 23rd Place
| K-12 School | 10.9 kg/sqft
Highest 10%
| 825 tons
Lowest 47%
|
|
Collins Academy High School
🕰️
(CPS)
1313 S Sacramento Blvd
| K-12 School | 10.9 kg/sqft | 2,243 tons |
|
SCI-Sinai
🕰️
2653 West Ogden Avenue
| Medical Office | 10.9 kg/sqft | 1,179 tons |
|
The Seneca
200 E Chestnut St
| Multifamily Housing | 10.9 kg/sqft
Highest 10%
| 1,830 tons
Highest 25%
|
|
Chicago Triplex
515 N Clark St
| Hotel | 10.9 kg/sqft
Highest 10%
| 3,734 tons
Highest 10%
|
|
3101-3121 N Sheridan Rd
3101-3121 N Sheridan Rd
| Multifamily Housing | 10.9 kg/sqft
Highest 10%
| 2,248 tons
Highest 20%
|
|
343 S DEARBORN ST
🕰️
343 S DEARBORN ST
| Multifamily Housing | 10.9 kg/sqft | 1,829 tons |
|
Archer Courts Apartments
🕰️
(CHA)
2220 2242 S PRINCETON AVE
| Multifamily Housing | 10.9 kg/sqft | 1,505 tons |
|
Palmolive Building Condominium Association
913 - 921 N Michigan Ave
| Multifamily Housing | 10.9 kg/sqft
Highest 10%
| 4,340 tons
Highest 8%
|
|
Belle Shore
1062 W Bryn Mawr Ave
| Multifamily Housing | 10.8 kg/sqft
Highest 11%
| 846 tons
Lowest 48%
|
|
Clark Academic Prep HS -CPS
🕰️
(CPS)
5101 W Harrison St
| K-12 School | 10.8 kg/sqft | 1,630 tons |
|
Uptown Bank Building
🕰️
4753 N Broadway St
| Office | 10.8 kg/sqft | 1,092 tons |
|
Washington Square-North and Cicero Development LLC
4821 - 4951 W North Ave
| Strip Mall | 10.8 kg/sqft
Highest 11%
| 1,930 tons
Highest 24%
|
|
Greek Islands (200 S Halsted)
200 210 S HALSTED ST
| Office | 10.8 kg/sqft
Highest 11%
| 1,240 tons
Highest 38%
|
|
2940 W 87TH ST
2940 W 87TH ST
| Senior Living Community | 10.8 kg/sqft
Highest 11%
| 723 tons
Lowest 42%
|
Data Source:
Chicago Energy Benchmarking Data
