Electrify Chicago
An independent tool for viewing City of Chicago building data
According to the
2022 Chicago Climate Action Plan,
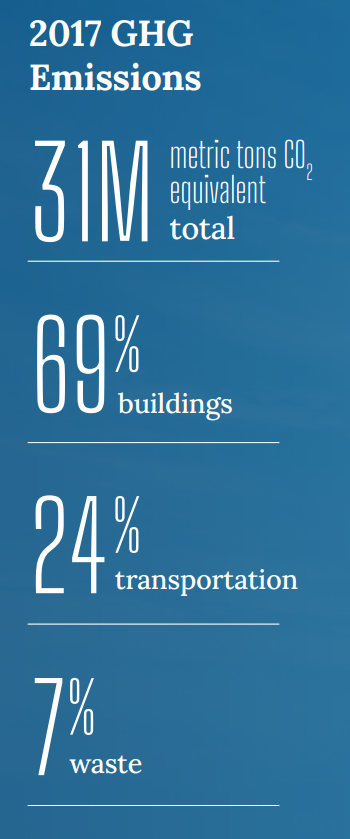
69% of Chicago's emissions come from buildings, making
building emissions our biggest challenge and our biggest opportunity as a city
to tackle climate change. At Electrify Chicago, we showcase building performance using
publicly available data supplemented by community-submitted photographs and building
owners.
Start by looking at Chicago's buildings with the highest greenhouse gas intensity i.e. emissions per square foot. Large, efficient, buildings can perform much better than very inefficient small buildings on this metric.
New Article
📰 $30 Million In Missed Fines
The City Of Chicago failed to collect $30 million in potential fines from the building benchmarking ordinance, reducing transparency and accountability.
Chicago Buildings by Greenhouse Gas Intensity
Note: Data From Large Buildings in 2022
Note: This data only includes buildings whose emissions are reported
under the
Chicago Energy Benchmarking Ordinance. According to the City “As of 2016,
this list includes all commercial, institutional, and residential buildings larger than
50,000 square feet.” This dataset is also then filtered to only buildings with
reported emissions > 1,000 metric tons CO2 equivalent.
The latest year of data is from 2022, but we update the site regularly when new data is available, and some buildings may have failed to report that year, and only have older data available.
Additionally, note that all tons specified are metric tons.
| Name / Address | Primary Property Type |
GHG Intensity (kg CO2 eq./sqft) |
Total GHG Emissions (tons CO2 eq.) |
|---|---|---|---|
|
Second Prairie Shores, LLC
2951 S King Dr
| Multifamily Housing | 8.5 kg/sqft
Highest 21%
| 2,473 tons
Highest 18%
|
|
Third Prairie Shores, LLC
3001 S King Dr
| Multifamily Housing | 8.5 kg/sqft
Highest 21%
| 2,469 tons
Highest 18%
|
|
401 S Clinton St
401 S Clinton St
| Office | 8.5 kg/sqft
Highest 21%
| 1,398 tons
Highest 34%
|
|
Hampton Inn and Suites Chicago
33 W Illinois St
| Hotel | 8.5 kg/sqft
Highest 21%
| 1,361 tons
Highest 35%
|
|
Graham School of Management, St. Xavier University
3700 W 103rd St
| College/University | 8.5 kg/sqft
Highest 21%
| 3,968 tons
Highest 9%
|
|
542 S Dearborn
542 S Dearborn St
| Office | 8.5 kg/sqft
Highest 21%
| 733 tons
Lowest 42%
|
|
Home Depot, #1903 Brickyard
2555 N Normandy Ave
| Retail Store | 8.5 kg/sqft
Highest 21%
| 1,170 tons
Highest 40%
|
|
732 W BITTERSWEET PL
732 W BITTERSWEET PL
| Multifamily Housing | 8.5 kg/sqft
Highest 21%
| 465 tons
Lowest 23%
|
|
4048 S LAKE PARK AVE
🕰️
4048 S LAKE PARK AVE
| Multifamily Housing | 8.5 kg/sqft | 473 tons |
|
7450 N ROGERS AVE
7450 N ROGERS AVE
| Multifamily Housing | 8.5 kg/sqft
Highest 21%
| 828 tons
Lowest 48%
|
|
1607 E 50TH PL
1607 E 50TH PL
| Multifamily Housing | 8.5 kg/sqft
Highest 21%
| 505 tons
Lowest 27%
|
|
5550 5556 S DORCHESTER AVE
5550 5556 S DORCHESTER AVE
| Multifamily Housing | 8.4 kg/sqft
Highest 22%
| 684 tons
Lowest 39%
|
|
513 W Fullerton Pkwy
🕰️
513 W Fullerton Pkwy
| Senior Care Community | 8.4 kg/sqft | 815 tons |
|
Catholic Charities: St. Leo Residence
7750 S Emerald Ave
| Multifamily Housing | 8.4 kg/sqft
Highest 22%
| 554 tons
Lowest 30%
|
|
Bond Chapel/ Cobb, Swift, Haskell, Wieboldt, Goodspeed, Gates, and Blake Hall
(UChicago)
5811 - 5827 S Ellis Ave
| College/University | 8.4 kg/sqft
Highest 22%
| 669 tons
Lowest 38%
|
Data Source:
Chicago Energy Benchmarking Data
