Electrify Chicago
An independent tool for viewing City of Chicago building data
According to the
2022 Chicago Climate Action Plan,
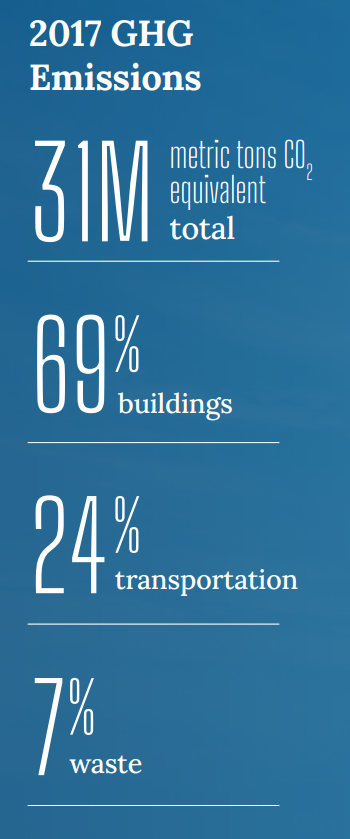
69% of Chicago's emissions come from buildings, making
building emissions our biggest challenge and our biggest opportunity as a city
to tackle climate change. At Electrify Chicago, we showcase building performance using
publicly available data supplemented by community-submitted photographs and building
owners.
Start by looking at Chicago's buildings with the highest greenhouse gas intensity i.e. emissions per square foot. Large, efficient, buildings can perform much better than very inefficient small buildings on this metric.
New Article
📰 $30 Million In Missed Fines
The City Of Chicago failed to collect $30 million in potential fines from the building benchmarking ordinance, reducing transparency and accountability.
Chicago Buildings by Greenhouse Gas Intensity
Note: Data From Large Buildings in 2022
Note: This data only includes buildings whose emissions are reported
under the
Chicago Energy Benchmarking Ordinance. According to the City “As of 2016,
this list includes all commercial, institutional, and residential buildings larger than
50,000 square feet.” This dataset is also then filtered to only buildings with
reported emissions > 1,000 metric tons CO2 equivalent.
The latest year of data is from 2022, but we update the site regularly when new data is available, and some buildings may have failed to report that year, and only have older data available.
Additionally, note that all tons specified are metric tons.
| Name / Address | Primary Property Type |
GHG Intensity (kg CO2 eq./sqft) |
Total GHG Emissions (tons CO2 eq.) |
|---|---|---|---|
|
6250 6258 S PARK SHORE EAST CT
🕰️
6250 6258 S PARK SHORE EAST CT
| Multifamily Housing | 7.7 kg/sqft | 1,160 tons |
|
215 West Apartments
215 W Washington St
| Multifamily Housing | 7.7 kg/sqft
Highest 29%
| 2,978 tons
Highest 14%
|
|
111 S Wacker
🚩
111 S Wacker
| Office | 7.7 kg/sqft
Highest 29%
| 9,600 tons
Highest 3%
|
|
Hyatt Regency Chicago
🚩
151 E Wacker Dr
| Hotel | 7.7 kg/sqft
Highest 29%
| 15,625 tons #29 Highest
|
|
Hyatt House West Loop/Fulton Market
🕰️
105 N MAY ST
| Hotel | 7.6 kg/sqft | 1,124 tons |
|
The Residences at 8 East Huron
8 E Huron St
| Multifamily Housing | 7.6 kg/sqft
Highest 30%
| 1,303 tons
Highest 36%
|
|
3527 W North Avenue
3527 W North Avenue
| Multifamily Housing | 7.6 kg/sqft
Highest 30%
| 392 tons
Lowest 16%
|
|
210 N Carpenter St
210 N Carpenter St
| Office | 7.6 kg/sqft
Highest 30%
| 1,811 tons
Highest 26%
|
|
The Gwen
521 N Rush St
| Hotel | 7.6 kg/sqft
Highest 30%
| 2,727 tons
Highest 16%
|
|
1825 W Lawrence Ave
🕰️
1825 W Lawrence Ave
| Bank Branch | 7.6 kg/sqft | 406 tons |
|
Joplin Elementary -CPS
(CPS)
7931 S Honore St
| K-12 School | 7.6 kg/sqft
Highest 30%
| 593 tons
Lowest 33%
|
|
James Ward Elementary -CPS
(CPS)
2701 S Shields Ave
| K-12 School | 7.6 kg/sqft
Highest 30%
| 644 tons
Lowest 37%
|
|
Peterson Elementary -CPS
(CPS)
5500 N CHRISTIANA
| K-12 School | 7.6 kg/sqft
Highest 30%
| 740 tons
Lowest 43%
|
|
Evergreen Academy Middle School
🕰️
(CPS)
3537 S Paulina St
| K-12 School | 7.6 kg/sqft | 379 tons |
|
1100 N Dearborn St
1100 N Dearborn St
| Multifamily Housing | 7.6 kg/sqft
Highest 30%
| 1,357 tons
Highest 35%
|
Data Source:
Chicago Energy Benchmarking Data
