Electrify Chicago
An independent tool for viewing City of Chicago building data
According to the
2022 Chicago Climate Action Plan,
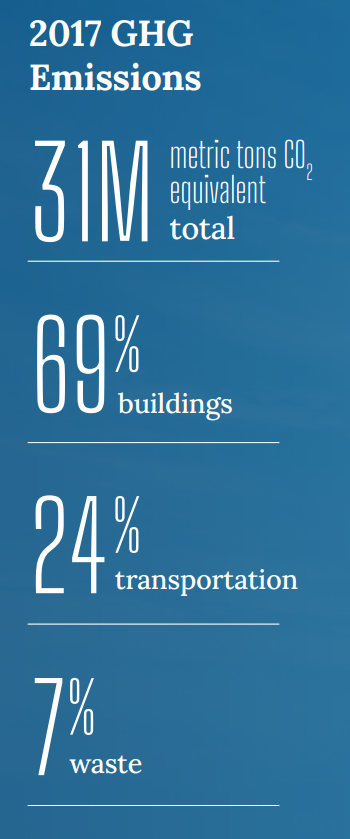
69% of Chicago's emissions come from buildings, making
building emissions our biggest challenge and our biggest opportunity as a city
to tackle climate change. At Electrify Chicago, we showcase building performance using
publicly available data supplemented by community-submitted photographs and building
owners.
Start by looking at Chicago's buildings with the highest greenhouse gas intensity i.e. emissions per square foot. Large, efficient, buildings can perform much better than very inefficient small buildings on this metric.
New Article
📰 $30 Million In Missed Fines
The City Of Chicago failed to collect $30 million in potential fines from the building benchmarking ordinance, reducing transparency and accountability.
Chicago Buildings by Greenhouse Gas Intensity
Note: Data From Large Buildings in 2022
Note: This data only includes buildings whose emissions are reported
under the
Chicago Energy Benchmarking Ordinance. According to the City “As of 2016,
this list includes all commercial, institutional, and residential buildings larger than
50,000 square feet.” This dataset is also then filtered to only buildings with
reported emissions > 1,000 metric tons CO2 equivalent.
The latest year of data is from 2022, but we update the site regularly when new data is available, and some buildings may have failed to report that year, and only have older data available.
Additionally, note that all tons specified are metric tons.
| Name / Address | Primary Property Type |
GHG Intensity (kg CO2 eq./sqft) |
Total GHG Emissions (tons CO2 eq.) |
|---|---|---|---|
|
1050 W 79TH ST
1050 W 79TH ST
| Senior Living Community | 7.3 kg/sqft
Highest 34%
| 440 tons
Lowest 20%
|
|
Sherway Tower
4225 N SHERIDAN RD
| Multifamily Housing | 7.3 kg/sqft
Highest 34%
| 1,162 tons
Highest 40%
|
|
1230 N STATE PKWY
1230 N STATE PKWY
| Multifamily Housing | 7.3 kg/sqft
Highest 34%
| 1,063 tons
Highest 43%
|
|
North Park Tower Cooperative
🕰️
300 W. North Avenue
| Multifamily Housing | 7.3 kg/sqft | 846 tons |
|
1329 1341 W ESTES AVE
1329 1341 W ESTES AVE
| Multifamily Housing | 7.3 kg/sqft
Highest 34%
| 489 tons
Lowest 25%
|
|
Lewis & O'Malley
(DePaul)
25 E Jackson Blvd
| College/University | 7.3 kg/sqft
Highest 34%
| 2,792 tons
Highest 15%
|
|
200 S Wacker Property LLC
200 S Wacker Dr
| Office | 7.3 kg/sqft
Highest 34%
| 6,196 tons
Highest 5%
|
|
3812 S MICHIGAN AVE
🕰️
3812 S MICHIGAN AVE
| Multifamily Housing | 7.2 kg/sqft | 518 tons |
|
808 N Wells St
808 N Wells St
| Multifamily Housing | 7.2 kg/sqft
Highest 35%
| 1,594 tons
Highest 29%
|
|
Burnham Pointe
730 South Clark Street
| Multifamily Housing | 7.2 kg/sqft
Highest 35%
| 3,107 tons
Highest 13%
|
|
Regis Hall-ID#254172
🕰️
(Loyola)
6340 N Winthrop Ave
| Residence Hall/Dormitory | 7.2 kg/sqft | 883 tons |
|
South Commons
2901 S Michigan Ave
| Multifamily Housing | 7.2 kg/sqft
Highest 35%
| 1,316 tons
Highest 36%
|
|
824 West Superior Condominium Assocation
824 W Superior St
| Multifamily Housing | 7.2 kg/sqft
Highest 35%
| 474 tons
Lowest 24%
|
|
Circa 922
922 W Washington Blvd
| Multifamily Housing | 7.2 kg/sqft
Highest 35%
| 1,127 tons
Highest 41%
|
|
Funston, Frederick Elementary -CPS
(CPS)
2010 N Central Park Ave
| K-12 School | 7.2 kg/sqft
Highest 35%
| 779 tons
Lowest 45%
|
Data Source:
Chicago Energy Benchmarking Data
