Electrify Chicago
An independent tool for viewing City of Chicago building data
According to the
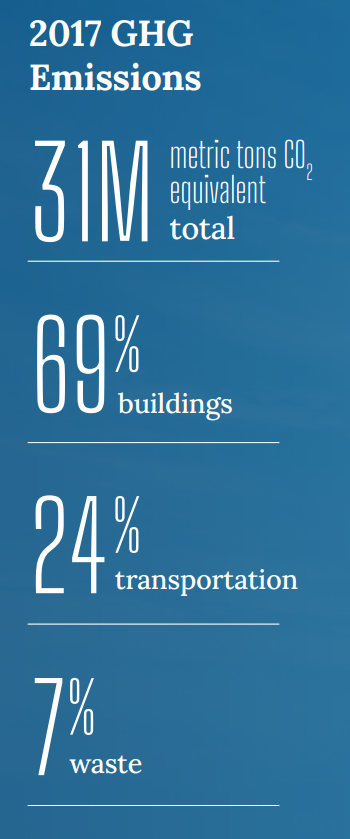
2022 Chicago Climate Action Plan, 69% of Chicago's emissions come from buildings,
making building emissions our biggest challenge and
our biggest opportunity as a city to tackle climate change.
At Electrify Chicago, we showcase building performance using
publicly available data supplemented by community-submitted
photographs and building owners.
Start by looking at Chicago's buildings with the highest greenhouse gas intensity i.e. emissions per square foot. Large, efficient, buildings can perform much better than very inefficient small buildings on this metric.
New Article
📰 $30 Million In Missed Fines
The City Of Chicago failed to collect $30 million in potential fines from the building benchmarking ordinance, reducing transparency and accountability.
Chicago Buildings by Greenhouse Gas Intensity
Note: Data From Large Buildings in 2022
Note: This data only includes buildings whose emissions
are reported under the
Chicago Energy Benchmarking Ordinance. According to the City “As of 2016, this list includes all
commercial, institutional, and residential buildings larger than 50,000
square feet.” This dataset is also then filtered to only buildings
with reported emissions > 1,000 metric tons CO2 equivalent.
The latest year of data is from 2022, but we update the site regularly when new data is available, and some buildings may have failed to report that year, and only have older data available.
Additionally, note that all tons specified are metric tons.
| Name / Address | Primary Property Type |
GHG Intensity (kg CO2 eq./sqft) |
Total GHG Emissions (tons CO2 eq.) |
|---|---|---|---|
|
1156 E 61ST ST
(UChicago)
1156 E 61ST ST
| Residence Hall/Dormitory | 6.8 kg/sqft
Highest 43%
| 2,622 tons
Highest 17%
|
|
Jane Addams Elementary School
10810 S Avenue H
| K-12 School | 6.8 kg/sqft
Highest 43%
| 421 tons
Lowest 19%
|
|
McDonald's Headquarters
110 N Carpenter
| Office | 6.8 kg/sqft
Highest 43%
| 4,397 tons
Highest 8%
|
|
North & Pulaski Apartments
3949 W NORTH AVE
| Multifamily Housing | 6.8 kg/sqft
Highest 43%
| 513 tons
Lowest 28%
|
|
Mercy Circle
3659 W 99TH ST
| Residential Care Facility | 6.8 kg/sqft
Highest 43%
| 992 tons
Highest 45%
|
|
Lycee Francais de Chicago
🕰️
1929 W WILSON AVE
| K-12 School | 6.8 kg/sqft | 591 tons |
|
JeffJack Apartments
601 W Jackson
| Multifamily Housing | 6.8 kg/sqft
Highest 43%
| 1,322 tons
Highest 36%
|
|
North Center Senior Housing - The Martha Washington
🕰️
2324 W Irving Park Rd
| Multifamily Housing | 6.8 kg/sqft | 705 tons |
|
Logan Arts Center
915 E 60th St
| Performing Arts | 6.8 kg/sqft
Highest 43%
| 1,288 tons
Highest 37%
|
|
Beecher, Kelley, Green, Foster, Social Science Research Building
(UChicago)
1126 E 59th St
| College/University | 6.8 kg/sqft
Highest 43%
| 477 tons
Lowest 24%
|
|
CICS Wrightwood
8130 S California Ave
| K-12 School | 6.8 kg/sqft
Highest 43%
| 369 tons
Lowest 14%
|
|
Shoop Acad Of Math/Science/Tech -CPS
🕰️
(CPS)
1460 W 112th St
| K-12 School | 6.8 kg/sqft | 844 tons |
|
Ames Middle -CPS
(CPS)
1920 N Hamlin Ave
| K-12 School | 6.8 kg/sqft
Highest 43%
| 856 tons
Lowest 49%
|
|
Mariano Azuela -CPS
(CPS)
4707 W Marquette Rd
| K-12 School | 6.8 kg/sqft
Highest 43%
| 648 tons
Lowest 37%
|
|
Brunson Math & Science -CPS
🕰️
(CPS)
5600 W Iowa St
| K-12 School | 6.8 kg/sqft | 695 tons |
Data Source:
Chicago Energy Benchmarking Data
