Gordon Center for Integrative Science (GCIS)
🚨

Chicago Building ID: 110848
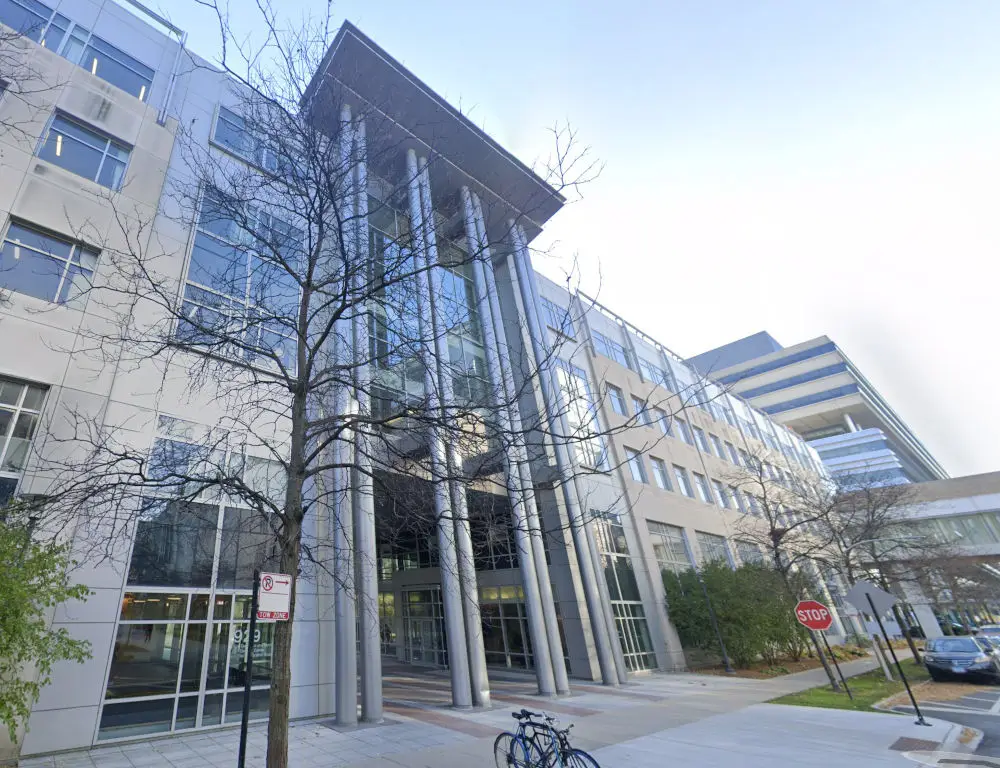
Attribution:
© Google 2026
Source
Building Info
- Square Footage
- 479,503 sqft#1 Largest of LaboratoriesHigher than 89% of all buildings3.9x median124,364 sqft3.6x median Laboratory132,867 sqft
- Built
- 2005
- Primary Property Type
- Laboratory
- Community Area
- Hyde Park
- Ward
- 5
-
Chicago Energy Rating
- 1.0 / 4
- Owner

Note: Owner manually tagged. Logo used under fair use.
2023 Report Card
Debug Full Grade Data
- AvgPercentileLetterGrade: D
- AvgPercentileGrade: 38.88137746908806
- GHGIntensityLetterGrade: F
- GHGIntensityPercentileGrade: 0.1944012441679632
- EnergyMixLetterGrade: B
- EnergyMixWeightedPctSum: 46.23511092473522
- EnergyMixPercentileGrade: 71.96044211751018
- SubmittedRecordsLetterGrade: A
- MissingRecordsCount: 0.0
- SubmittedRecordsPercentileGrade: 100.0
Emissions & Energy Information for 2023
- Greenhouse Gas Intensity F
- 41.1 kg CO2e / sqft#6 Highest in Chicago* 🚨#2 Highest of Laboratories 🚨7x median6.2 kg CO2e / sqft1.8x median Laboratory22.7 kg CO2e / sqft
- Total Greenhouse Gas Emissions
- 19,720 tons CO2e#15 Highest in Chicago* 🚩#1 Highest of Laboratories 🚨23x median841.4 tons CO2e7x median Laboratory2,857 tons CO2e
Years Reported
10/10
A


2014
2015
2016
2017
2018
2019
2020
2021
2022
2023
Energy Breakdown for Gordon Center for Integrative Science (GCIS)
- Fossil Gas Use (aka Natural Gas)
- 84,587 kBtuEst. Gas Bill: $1,000 for 2023**#28 Lowest in Chicago* 🏆1/65 median5,517,828 kBtu0.8x median Laboratory101,076 kBtu
- Electricity Use
- 26,620,107 kWh
 Est. Electric Bill: $3,807,000 for 2023**#21 Highest in Chicago* 🚩#1 Highest of Laboratories 🚨25x median1,049,335 kWh8x median Laboratory3,279,990 kWh
 - District Steam Use
- 105,535,293 kBtu17x median6,360,617 kBtu
Energy Mix B
Total Energy Use: 196,447,686 kBTU
Scan To Learn More
https://electrifychicago.net/building/110848
What Should We Do About This?
Own this Building? Check out our Take Action page for tips and advice!
View Extra Technical & Historic Info
- Source Energy Usage Intensity
- Not Reported
This data was not reported for this building this year, which likely means a value of zero for this field.
- Site Energy Usage Intensity
- Not Reported
This data was not reported for this building this year, which likely means a value of zero for this field.
Full Historical Data Table for Gordon Center for Integrative Science (GCIS)
| Year |
Overall Grade |
Emissions Intensity Sub-Grade |
Energy Mix Sub-Grade |
Reporting Mix Sub-Grade | GHG Intensity kg CO2e / sqft | GHG Emissions metric tons CO2e | Energy Mix | Electricity Use kBTU | Fossil Gas Use kBTU |
District Steam Use kBTU | Source EUI kBTU / sqft | Floor Area sqft |
Chicago Energy Rating |
|---|---|---|---|---|---|---|---|---|---|---|---|---|---|
| 2014 | F | F | F | A | 57.35 | 27,501 | 38%Electricity 0%Fossil Gas 62%Other | 89,021,468 | - | 144,812,352 | 946 | 479,503 | - |
| 2015 | D | F | B | A | 49.5 | 23,736 | 59%Electricity 0%Fossil Gas 41%Other | 95,910,296 | - | 67,259,708 | 796.8 | 479,503 | - |
| 2016 | D | F | C | A | 53.5 | 25,636 | 43%Electricity 0%Fossil Gas 57%Other | 94,731,177 | - | 123,127,668 | 929.3 | 479,503 | - |
| 2017 | D | F | C | A | 54.3 | 26,028 | 40%Electricity 0%Fossil Gas 60%Other | 91,658,535 | - | 136,761,956 | 943.3 | 479,503 | - |
| 2018 | D | F | B | A | 51.9 | 24,866 | 38%Electricity 0%Fossil Gas 62%Other | 90,941,879 | - | 146,645,885 | 899 | 479,503 | 1.0 |
| 2019 | D | F | B | A | 47.6 | 22,810 | 41%Electricity 0%Fossil Gas 59%Other | 90,590,784 | - | 130,606,884 | 856.7 | 479,503 | 1.0 |
| 2020 | C | F | A | A | 35.9 | 17,199 | 59%Electricity 0%Fossil Gas 40%Other | 85,442,080 | 81,790 | 58,133,857 | 645 | 479,503 | 2.0 |
| 2021 | D | F | B | A | 41.8 | 20,052 | 46%Electricity 0%Fossil Gas 54%Other | 90,471,193 | 90,492 | 107,324,452 | 797.8 | 479,503 | 1.0 |
| 2022 | D | F | B | A | 40 | 19,163 | 45%Electricity 0%Fossil Gas 55%Other | 89,788,714 | 91,419 | 110,431,366 | 801.6 | 479,503 | 1.0 |
| 2023 | D | F | B | A | 41.1 | 19,720 | 46%Electricity 0%Fossil Gas 54%Other | 90,827,805 | 84,587 | 105,535,293 | 795.3 | 479,503 | 1.0 |
View Data Notes & Disclaimers
* Note on Rankings: Rankings and medians are among included buildings, which are those who reported under the Chicago Energy Benchmarking Ordinance for the year 2023, which only applies to buildings over 50,000 square feet.
** Note on Bill Estimates:
Estimates for gas and electric bills are based on average electric
and gas retail prices for Chicago in
2021 and are rounded. We expect large buildings
would negotiate lower rates with utilities, but these estimates
serve as an upper bound of cost and help understand the volume of
energy a building is used by comparing it to your own energy bills!
See our
Chicago Gas & Electric Costs Source
for the original statistics.
Data Source:
Chicago Energy Benchmarking Data