Attribution:
© Google 2025
Source

Building Info
- Square Footage
- 114,868 sqftLower than 58% of all buildings0.8x median139,707 sqft0.8x median Multifamily Housing144,765 sqft
- Built
- 1954
- Primary Property Type
- Multifamily Housing
- Building Count
- 19
- Community Area
- Roseland
- Ward
- 9
-
Chicago Energy Rating
- 3.0 / 4
-
Energy Star Score
- 49 / 100
- Owner

Note: Owner manually tagged. Logo used under fair use.
Warning - Data Discrepencies Detected
We detected some issues with this building's data, so these grades may not be reflective of the building's true performance.
2022 Report Card
Debug Full Grade Data
- AvgPercentileLetterGrade: C
- AvgPercentileGrade: 40.840257054939336
- GHGIntensityLetterGrade: D
- GHGIntensityPercentileGrade: 34.82352941176471
- EnergyMixLetterGrade: C
- EnergyMixWeightedPctSum: 19.391848681091577
- EnergyMixPercentileGrade: 40.714088015499584
- SubmittedRecordsLetterGrade: B
- MissingRecordsCount: 2.0
- SubmittedRecordsPercentileGrade: 71.42857142857143
Emissions & Energy Information for 2022
- Greenhouse Gas Intensity D
- 7.2 kg CO2e / sqftHigher than 65% of all buildings1.1x median6.4 kg CO2e / sqft1.3x median Multifamily Housing5.7 kg CO2e / sqft
- Total Greenhouse Gas Emissions
- 821.9 tons CO2eLower than 53% of all buildings0.9x median885.8 tons CO2e1.1x median Multifamily Housing770.6 tons CO2e
Years Reported
5/7
B


2016
2017
2018

2019
2020
2021
2022
Energy Breakdown
- Fossil Gas Use (aka Natural Gas)
- 9,692,088 kBtuEst. Gas Bill: $116,000 for 2022**Higher than 69% of all buildings1.7x median5,818,399.6 kBtu1.5x median Multifamily Housing6,538,862.3 kBtu
- Electricity Use
- 2,331,619 kBtuEst. Electric Bill: $98,000 for 2022**Lower than 66% of all buildings0.6x median3,796,376.7 kBtu0.8x median Multifamily Housing2,848,153.7 kBtu
Energy Mix C
Total Energy Use: 12,023,708 kBTU
View Extra Technical & Historic Info
- Source Energy Usage Intensity
- Not Reported
This data was not reported for this building this year, which likely means a value of zero for this field.
- Site Energy Usage Intensity
- Not Reported
This data was not reported for this building this year, which likely means a value of zero for this field.
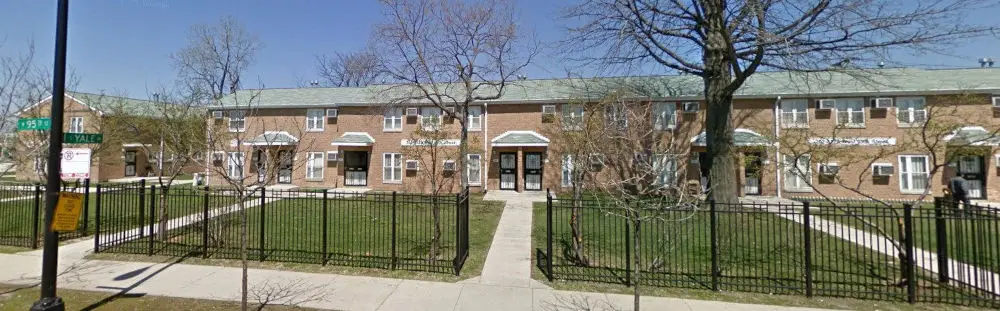
Full Historical Data Table for Lowden Homes
| Year |
Overall Grade |
Emissions Intensity Sub-Grade |
Energy Mix Sub-Grade |
Reporting Mix Sub-Grade | GHG Intensity kg CO2e / sqft | GHG Emissions metric tons CO2e | Energy Mix | Electricity Use kBTU | Fossil Gas Use kBTU |
District Steam Use kBTU |
District Chilled Water Use kBTU | Source EUI kBTU / sqft | Floor Area sqft |
Chicago Energy Rating |
Energy Star Score |
|---|---|---|---|---|---|---|---|---|---|---|---|---|---|---|---|
| 2016 | B | A | D | B | 0.8 | 94.6 | 30%Electricity 70%Fossil Gas 0%Other | 309,516 | 706,095 | - | - | 14.9 | 114,868 | - | 100.0 |
| 2017 | F | F | F | B | 45.3 | 5,198 | 2%Electricity 98%Fossil Gas 0%Other | 1,846,322 | 91,453,716 | - | - | 886.4 | 114,868 | - | 1.0 |
| 2018 | F | F | F | B | 55 | 6,320 | 2%Electricity 98%Fossil Gas 0%Other | 1,919,182 | 112,979,626 | - | - | 1079.5 | 114,868 | 1.0 | 1.0 |
| 2019 | - | - | - | - | - | - | 0.0 | - | |||||||
| 2020 | F | F | F | B | 48.1 | 5,530 | 2%Electricity 98%Fossil Gas 0%Other | 1,786,862 | 98,870,772 | - | - | 947.3 | 114,868 | 1.0 | 1.0 |
| 2021 | - | - | - | - | - | 114,868 | 0.0 | - | |||||||
| 2022 | C | D | C | B | 7.2 | 821.9 | 19%Electricity 81%Fossil Gas 0%Other | 2,331,619 | 9,692,089 | - | - | 145.4 | 114,868 | 3.0 | 49.0 |
* Note on Rankings: Rankings and medians are among included buildings, which are those who reported under the Chicago Energy Benchmarking Ordinance for the year 2022, which only applies to buildings over 50,000 square feet.
** Note on Bill Estimates:
Estimates for gas and electric bills are based on average electric and
gas retail prices for Chicago in 2021 and
are rounded. We expect large buildings would negotiate lower rates with
utilities, but these estimates serve as an upper bound of cost and help
understand the volume of energy a building is used by comparing it to
your own energy bills! See our
Chicago Gas & Electric Costs Source
for the original statistics.
Data Source:
Chicago Energy Benchmarking Data